Runbook
Read a market street by street
Everyone knows roughly where the money is in the market they cover. What is hard is being specific about it: which four houses on that street the county actually values over $1M, which of them are held by somebody who lives elsewhere, and which one has quietly assembled the two lots behind it. This runbook is how to read that off the map — and none of it costs a credit.
Before you start
The one thing that limits you here
This run has almost no prerequisites, which is the point of putting it first. The single real constraint is geographic licensing, and it is worth understanding before you pick a market rather than after.
What you need
A state you are licensed for
Parcel data is licensed by state. Starter includes 1, Professional 2, and Enterprise 5, with additional states at $49 per month each. Pick the state you actually work before you start exploring, because that decision shapes what you can see.
A value threshold in mind
The map has six value bands and it is genuinely useful to decide which of them you care about before you look. A million dollars means something very different in Palo Alto than it does in Tulsa, and the bands are absolute rather than relative to the local market.
No credits at all
Every step in the run below is unbilled: panning, searching, filtering, zooming in far enough to read deed owner names, and opening the property drawer. This is the part of Plotbook you can use as much as you like.
What you end up with
A named shortlist rather than an area
By the end you are not looking at a wealthy neighborhood, you are looking at eleven specific parcels with the names printed on their deeds, which is a completely different starting position for everything that comes after.
A split you can act on
The same read tells you which of those names are people, answerable with an instant lookup, and which are entities that need research. That split is what determines what the next stage costs.
A view that is still there tomorrow
Filters and map position persist across sessions, and searches you have run are kept locally, so a territory you set up once stays set up. Working three markets does not mean rebuilding the view three times a day.
The run
Four moves, all of them free
The map rewards working from the outside in: choose the market at low zoom, set the bands before you get close, then use zoom deliberately rather than continuously. Each zoom threshold turns on a different piece of information.
- 1No credits
Choose the market from altitude
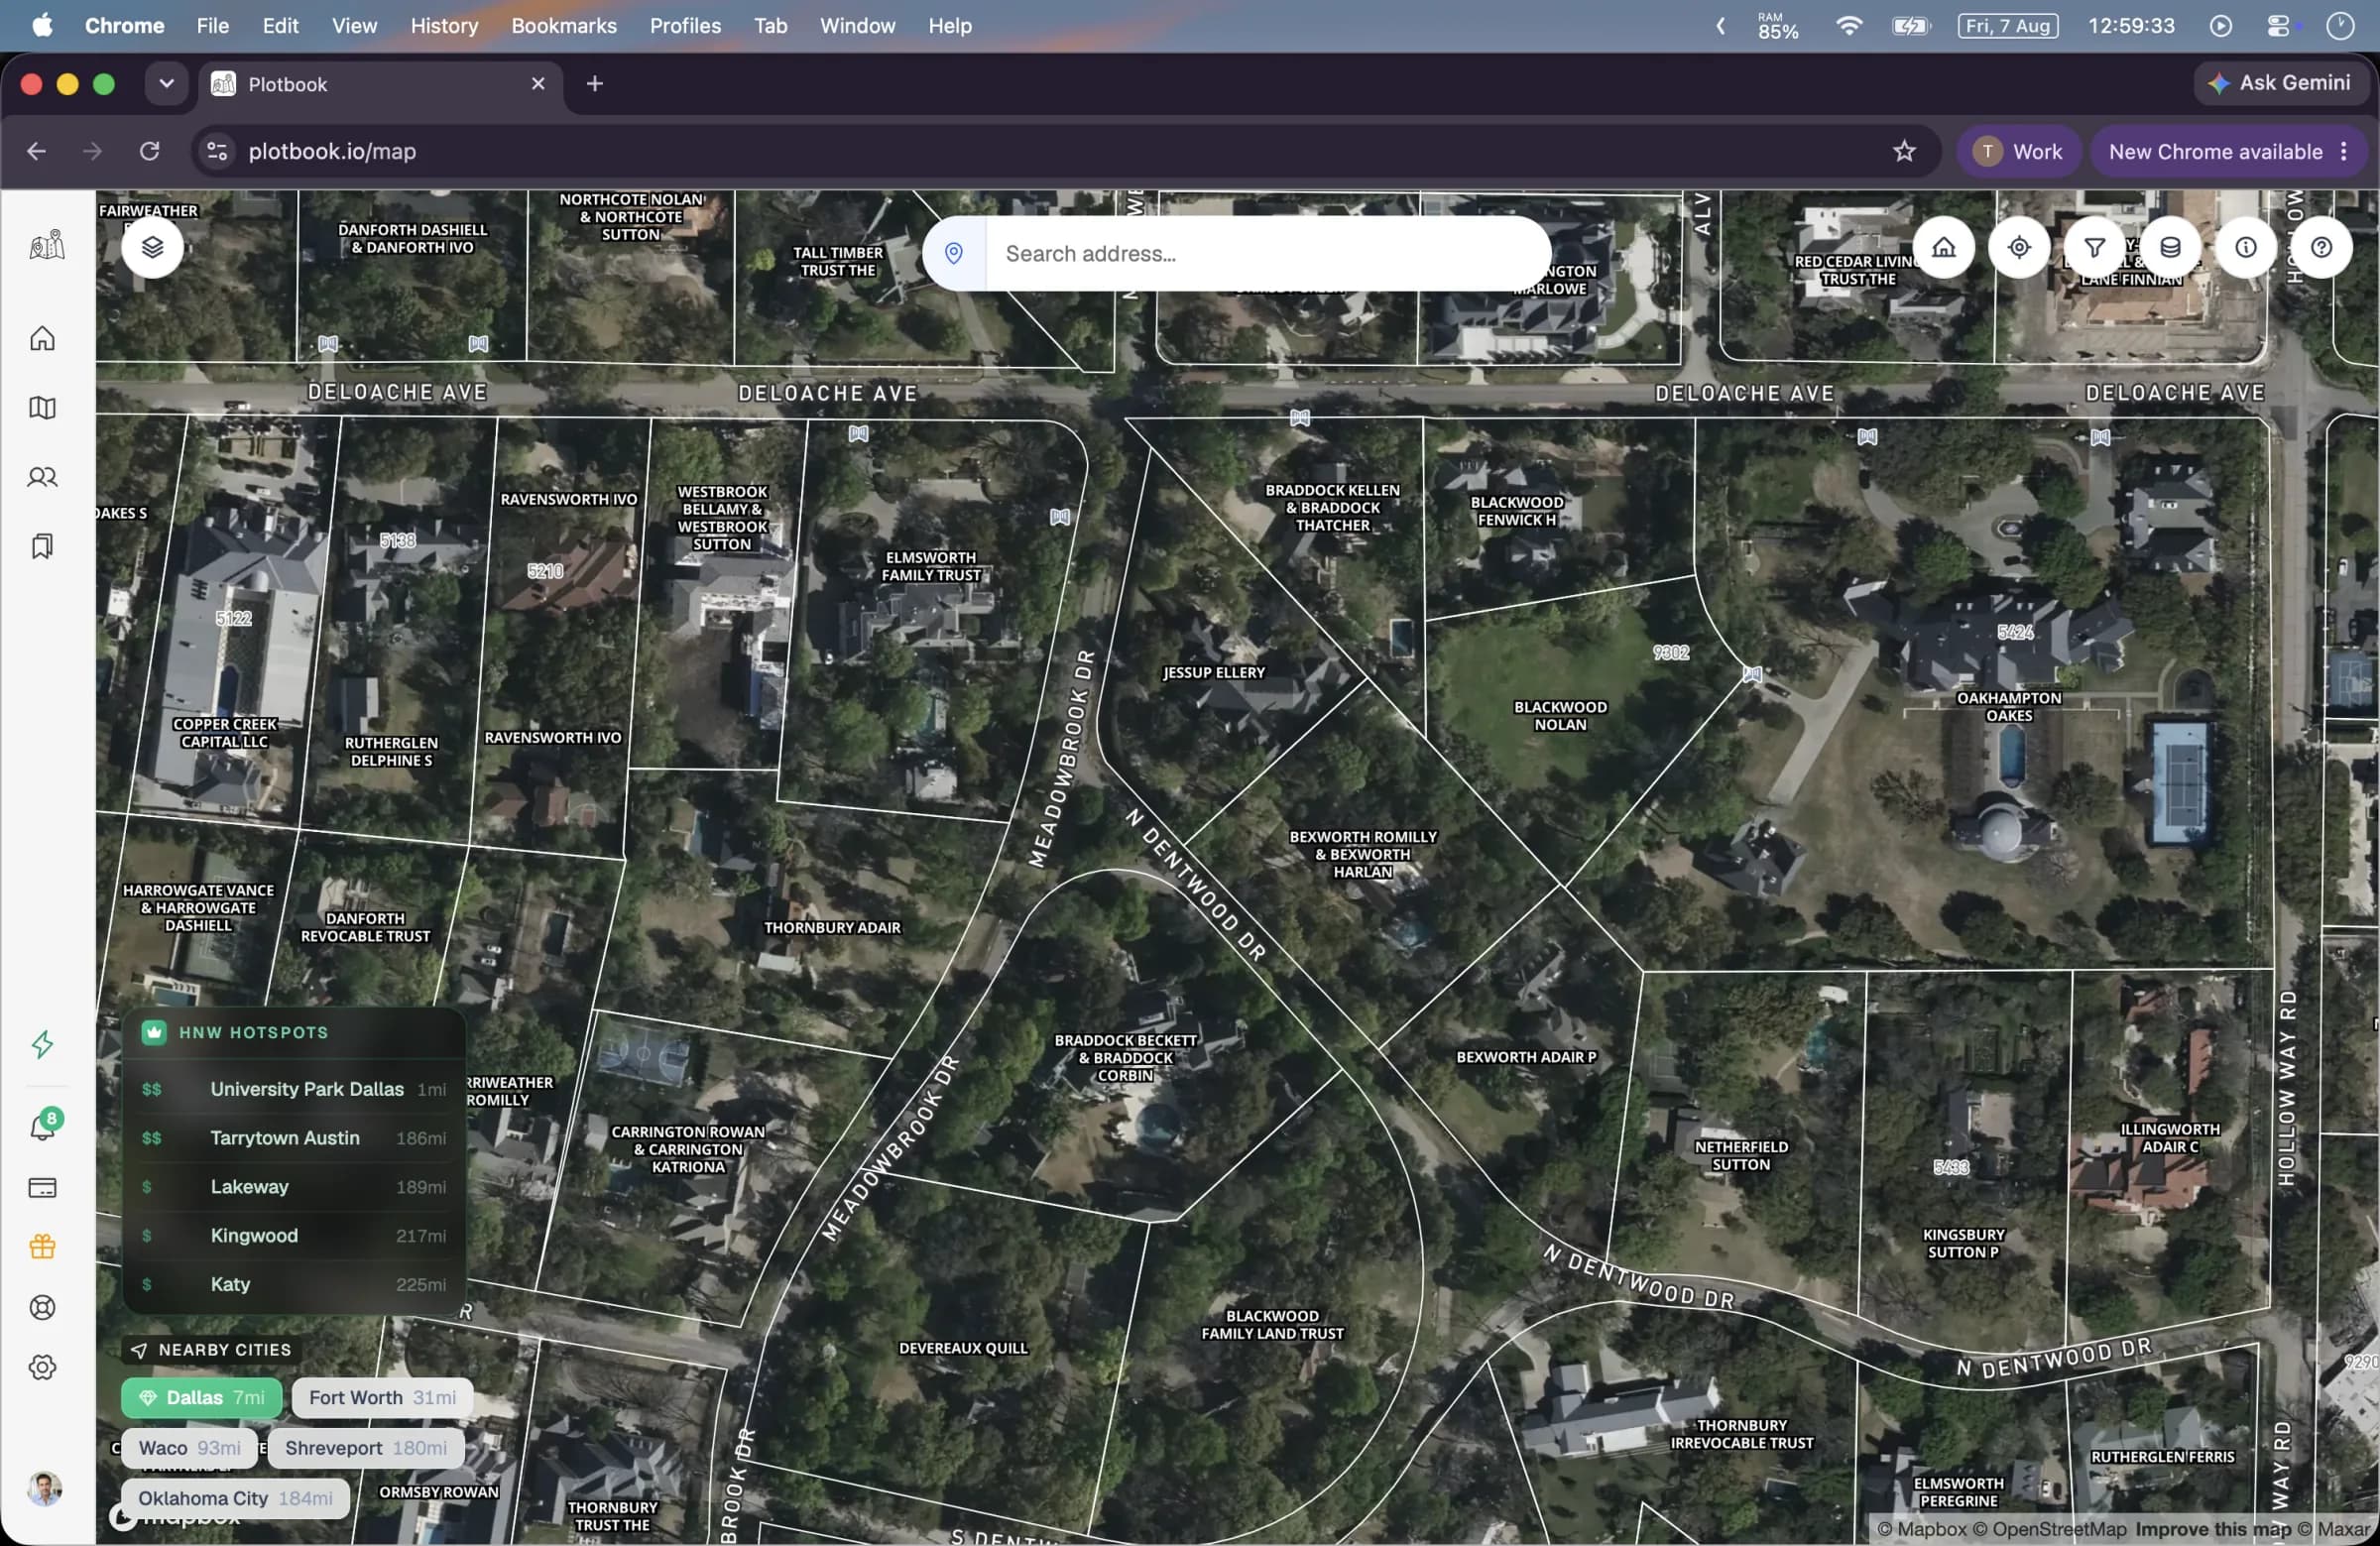
Zoom out to see the wealth hotspot layer, or search straight to a city or ZIP if you already know where you are going.
From zoom 3 to 10, 232 hand-curated high-net-worth ZIP codes render as a heatmap. From zoom 4 to 10 they collapse into clusters graded $ through $$$$ by density, which you can click to expand. Between 8 and 13 they become individual badges, and from 11 to 13 they pick up area labels — Palm Beach County, and so on. Clicking one flies you to it.
A nearby-areas widget lists up to five wealthy areas close to whatever you are currently looking at, which is the single most useful feature here for anyone expanding out of a territory they already work. It answers the question of where to look next without you guessing.
Be clear about what this layer is: a curated list of ZIP codes chosen as high-net-worth areas, rendered by density. It is not a computed measure of household wealth in those ZIPs, and no per-household figure is derived from it. It tells you where to point the map, and the parcels underneath do the actual work.
- 2No credits
Set the value bands before you zoom in
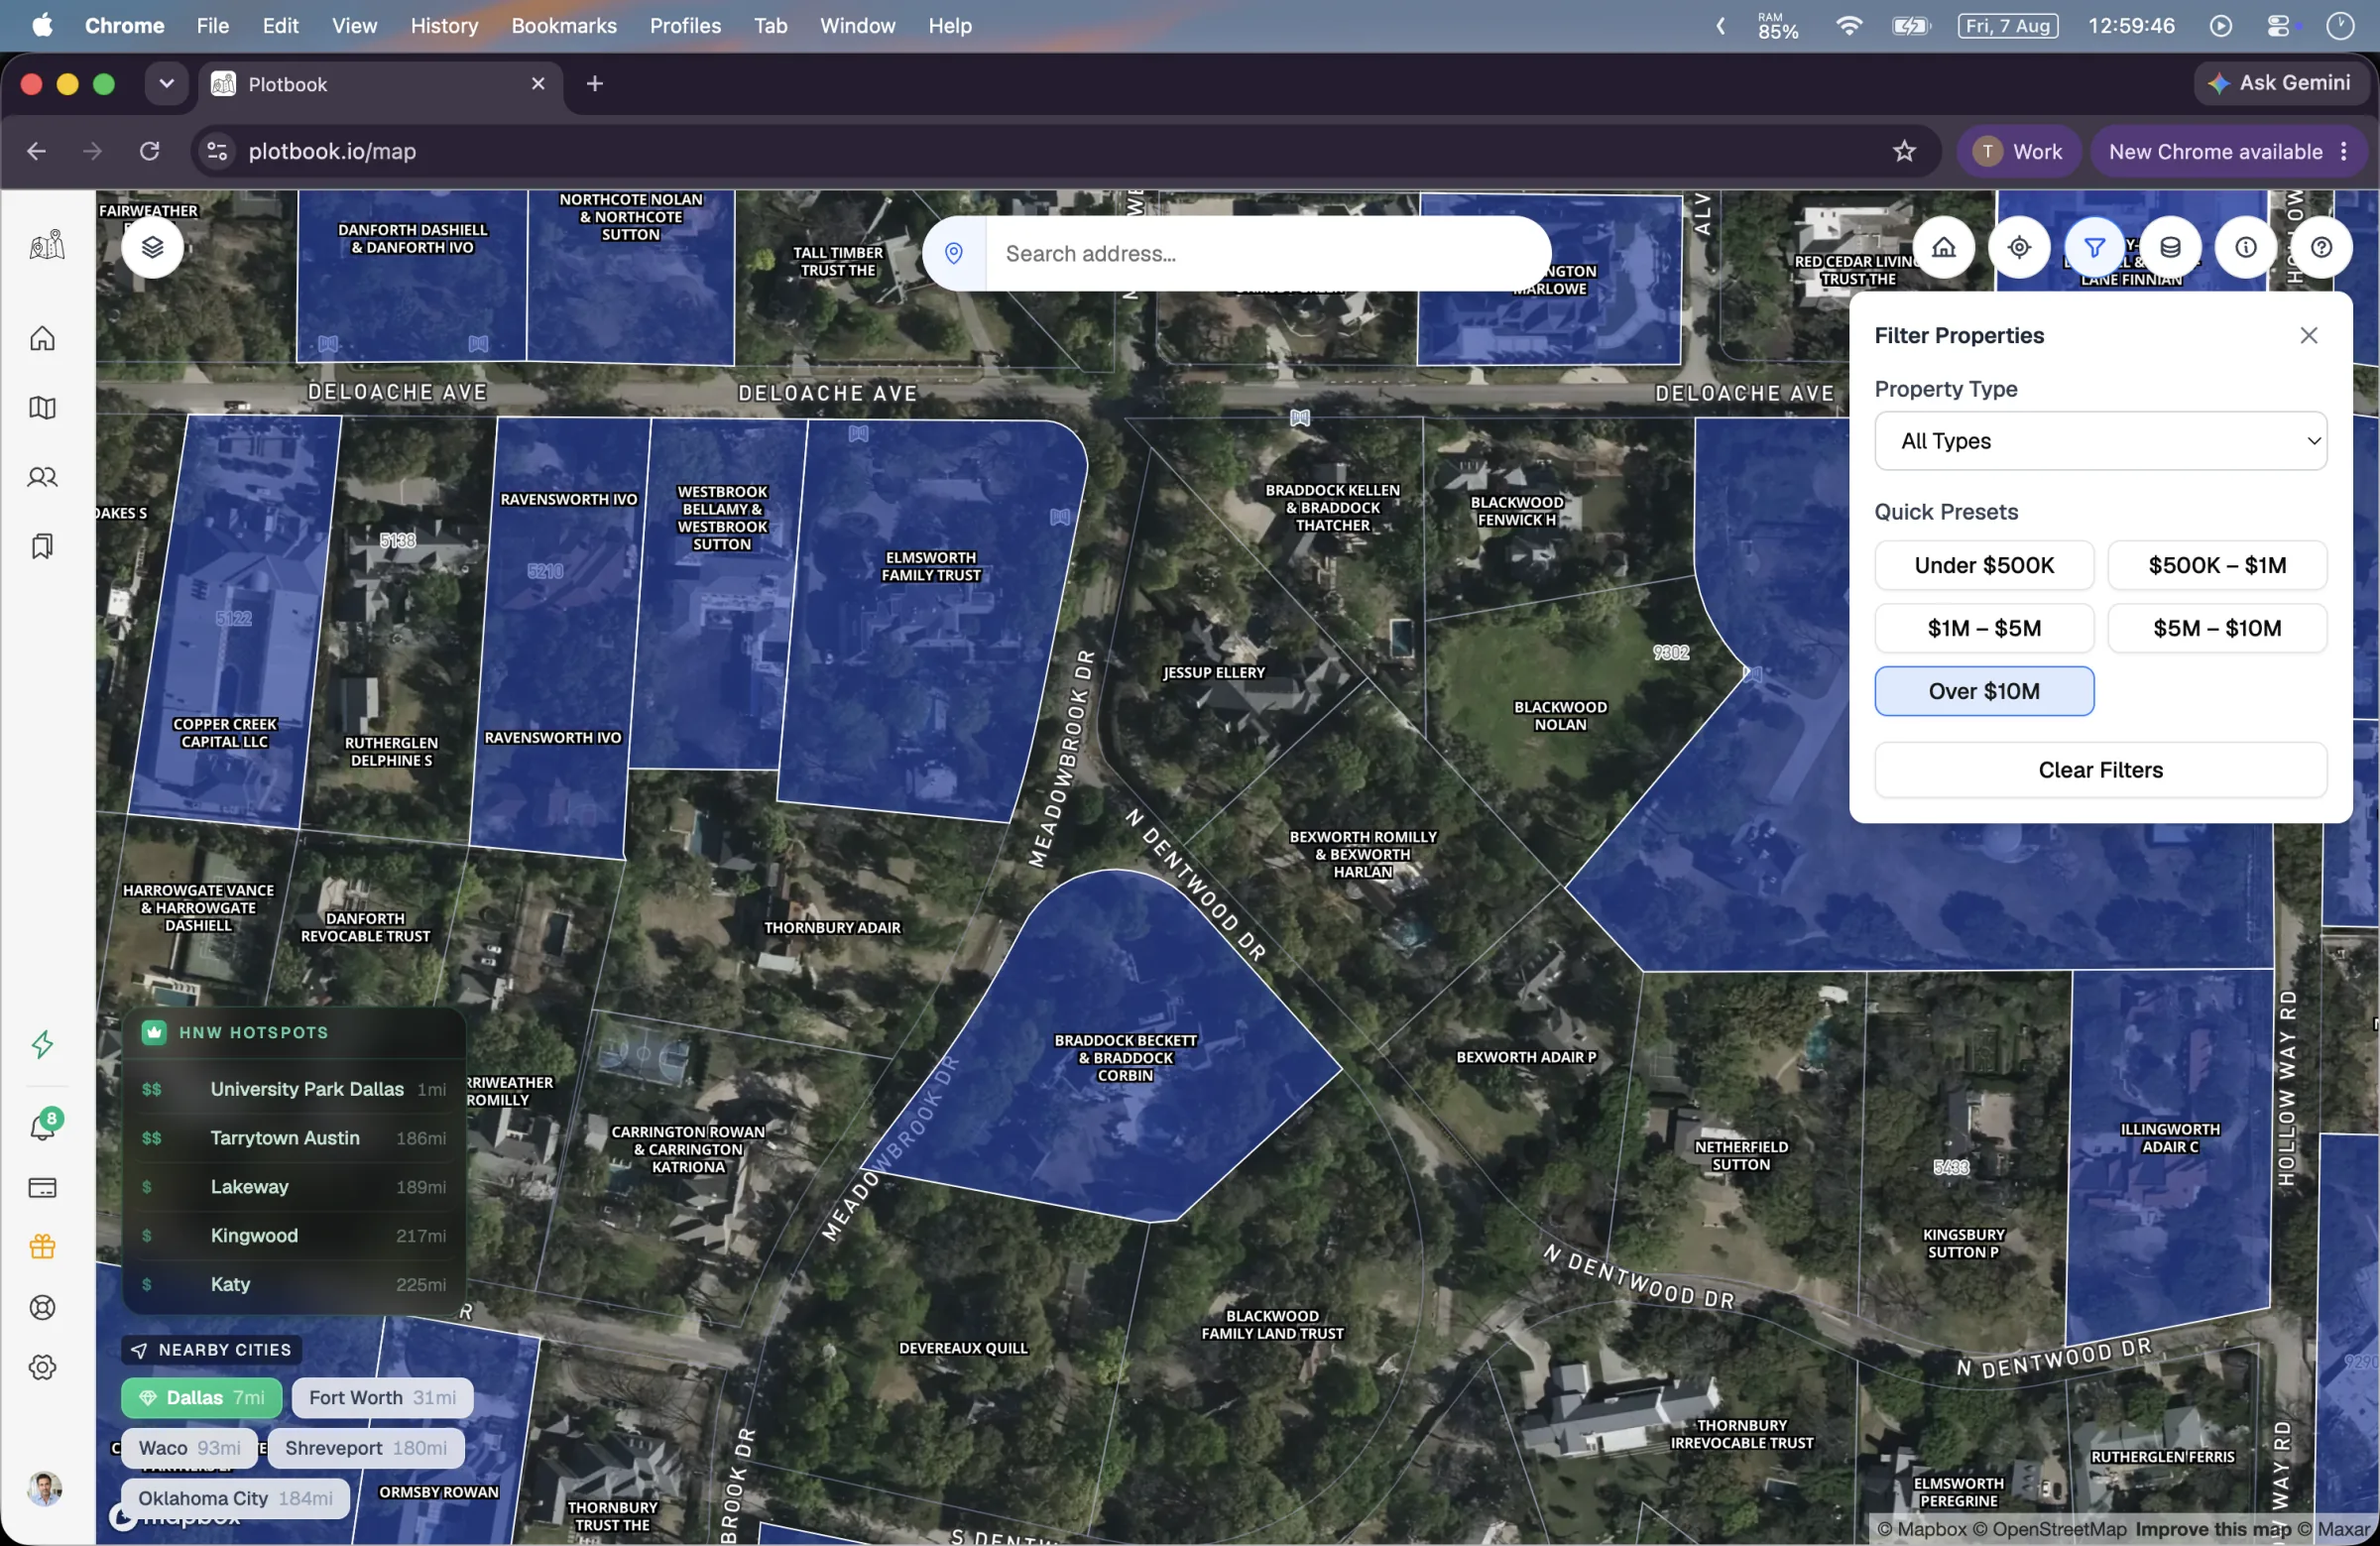
Open the filters panel and switch on the bands at and above your threshold. For million-dollar homes that means $1M to $5M and up.
Parcels are colored by county assessed value in six bands: unknown, under $500K, $500K to $1M, $1M to $5M, $5M to $10M, and over $10M. Five filter presets match those bands, each toggled independently, so you can look at $1M to $5M alone or at everything above $1M at once.
Filtered-out parcels do not vanish. They keep a dimmed outline and stay clickable, which means the street still reads as a street and you can check a neighbor without dismantling your filter. Whatever you set persists across sessions.
The unknown band deserves a moment. It is not a hole in Plotbook — it is a parcel for which the county publishes no assessed value, and in some counties that covers a meaningful share of records. An unknown parcel in an expensive block is worth a look rather than a skip.
- Six color bands, five toggleable presets, persisted per session.
- The legend can be toggled, and the coloring itself switched off with the palette control when you want to read the basemap.
- There is no property-type filter. The panel's Residential/Commercial control does not change what is drawn — do not plan a workflow around it.
Watch for: Assessed value is not market value. It is what a county assessor recorded for tax purposes, it can trail a sale by years, and assessment practice differs by state. Within one county it ranks properties well. Across two, it does not compare.
- 3No credits
Work the zoom thresholds
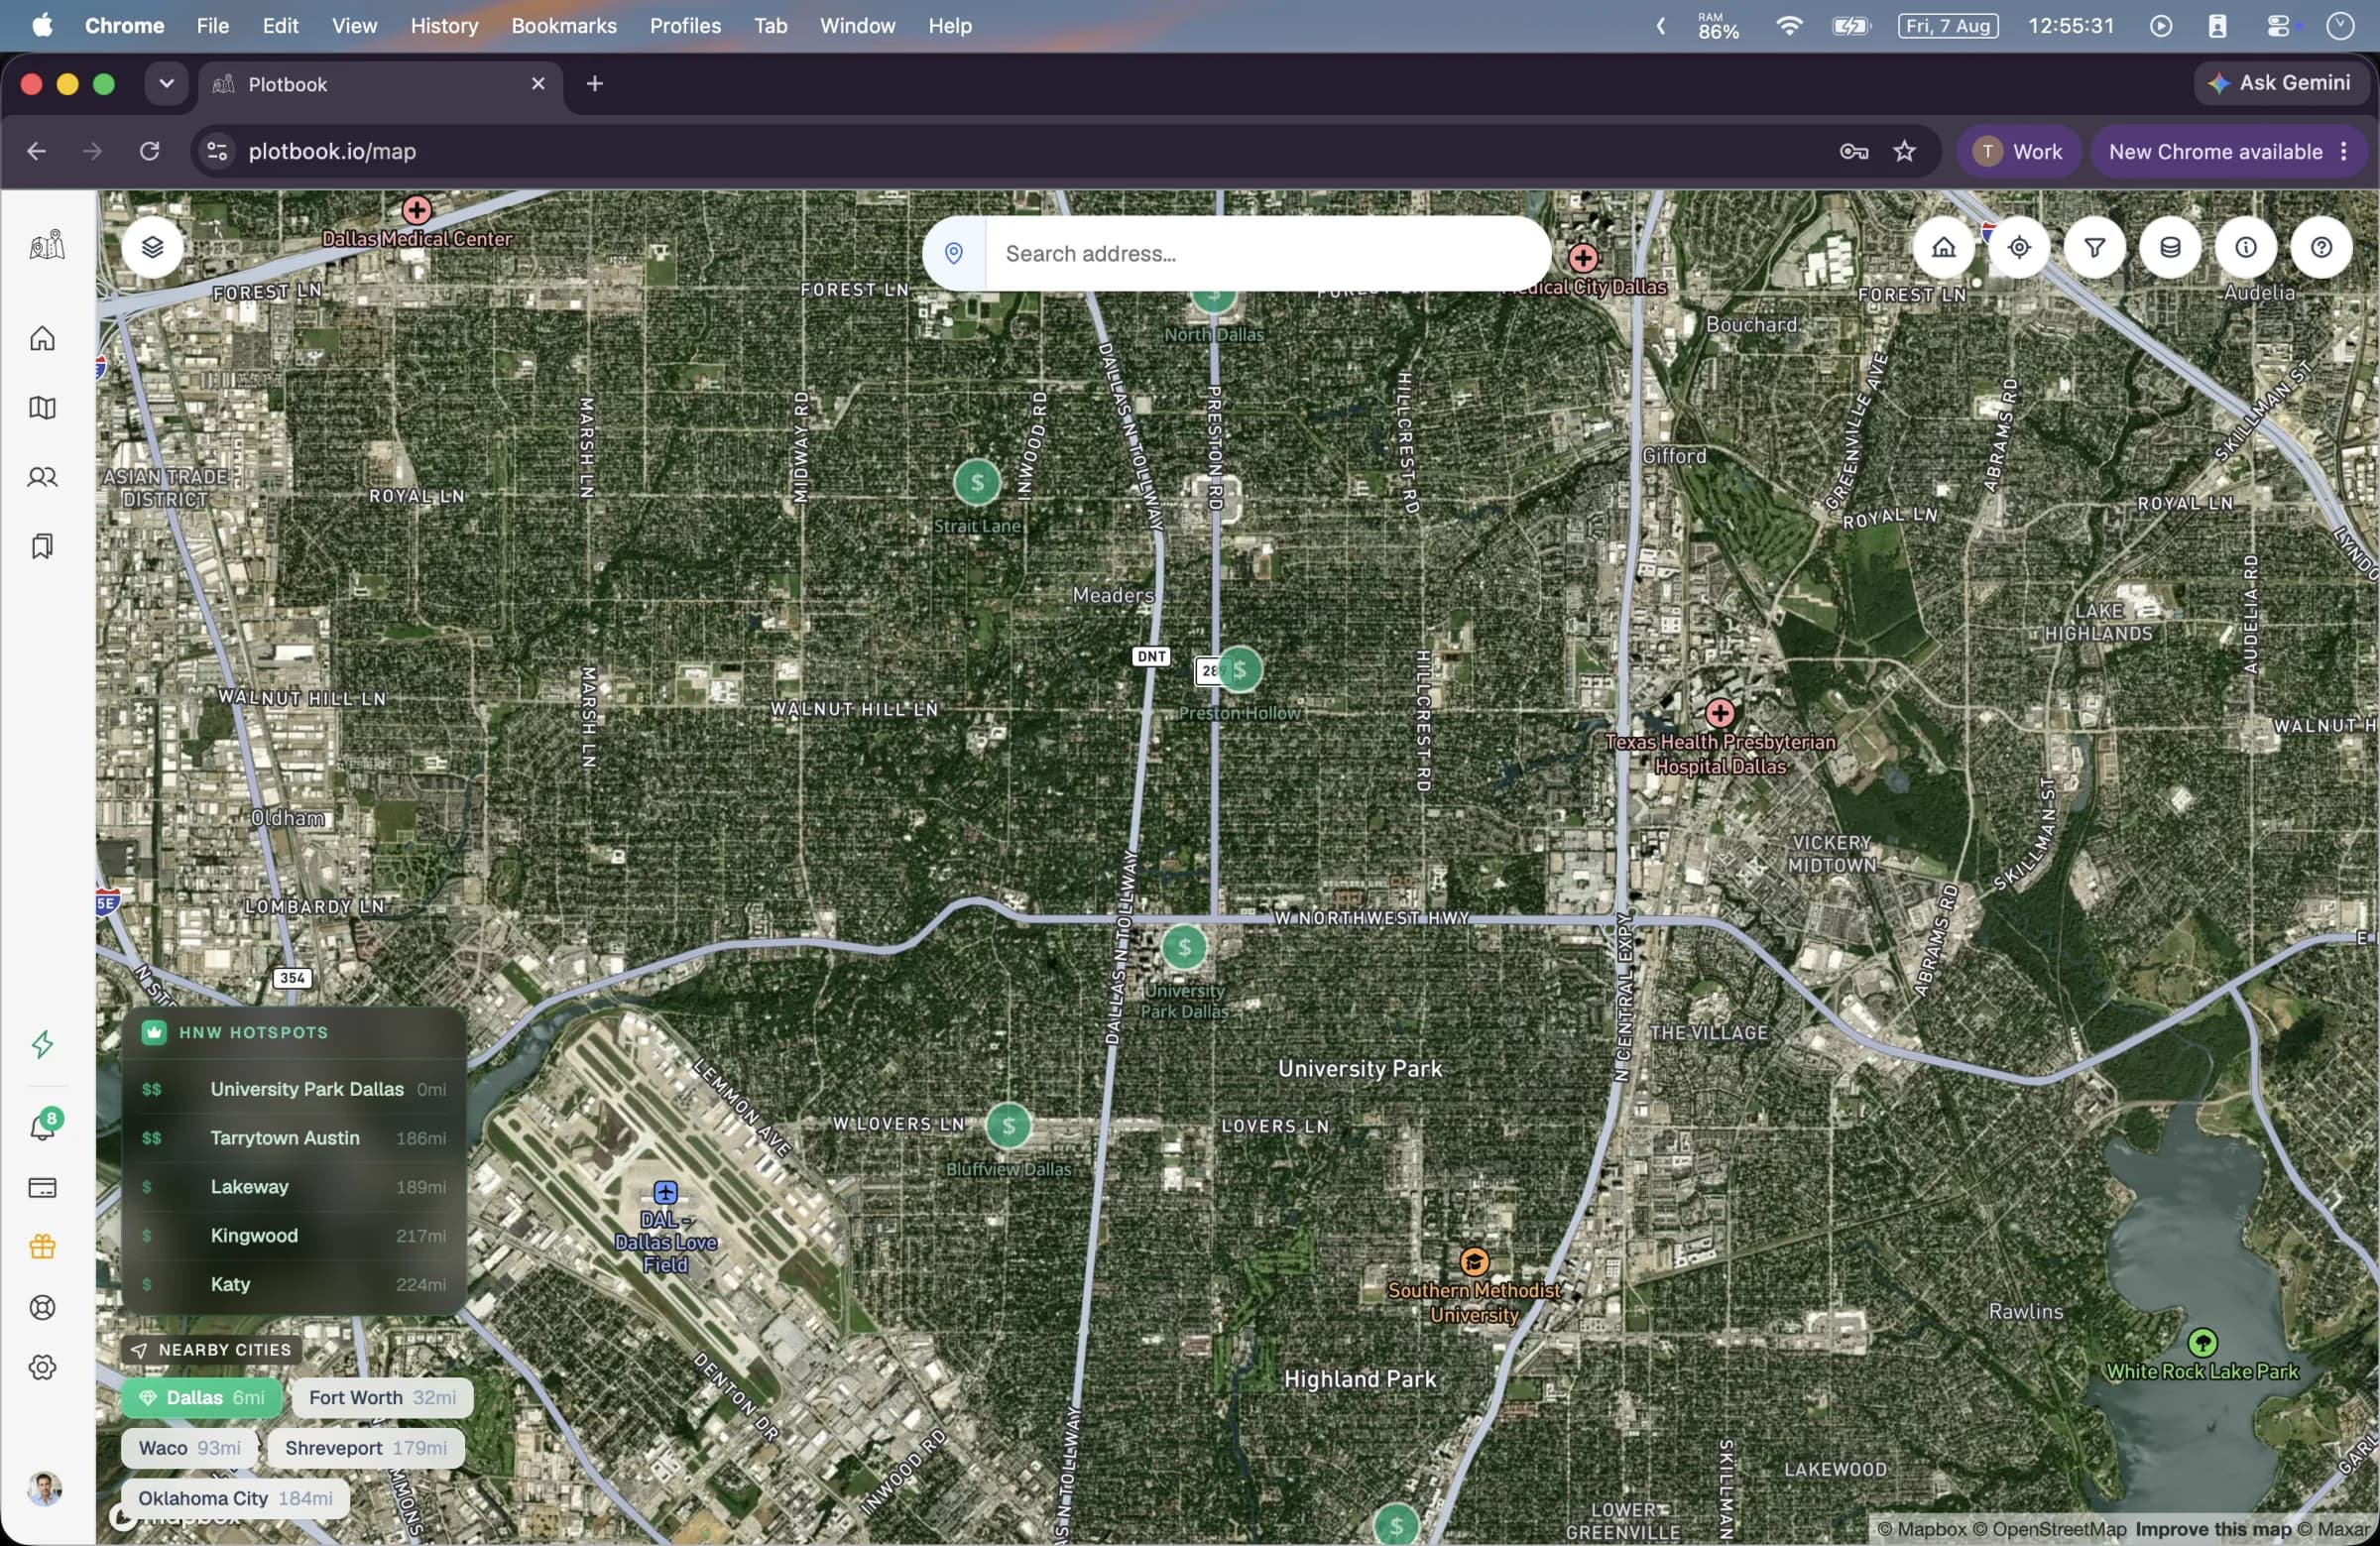
Zoom 14 turns on parcels. Zoom 16 puts the deed owner's name on every one of them. Between the two, the large holdings label themselves early.
These thresholds are the actual mechanics of reading a market, and knowing them saves a lot of aimless scrolling. Below 14 there are no parcel boundaries, only the hotspot layer. At 14 the parcels draw with their value coloring. At 16 every parcel carries the owner name printed on the deed, straight off the tile.
Between 14 and 16 an overlay labels the large parcels early — roughly fourteen acres and up at zoom 14, down to about an acre by 16 — and sorts them so the highest-value parcels win when labels collide. That is how the estate at the end of the road announces itself before you can read the street it is on, and it is the fastest way to find assembled lots and unusually large holdings in an otherwise ordinary neighborhood.
Three basemaps are available, including satellite. On satellite at zoom 16 and up you get the deed owner's name laid over an aerial view of the actual property, which is a more informative combination than either layer alone when you are trying to judge what is really there.
Watch for: The search bar finds places, not people. Owner names are readable on the map but not searchable from it, so if your starting point is a person's name rather than a location, this is the wrong run — start from people search instead.
- 4No credits
Open the parcels worth reading
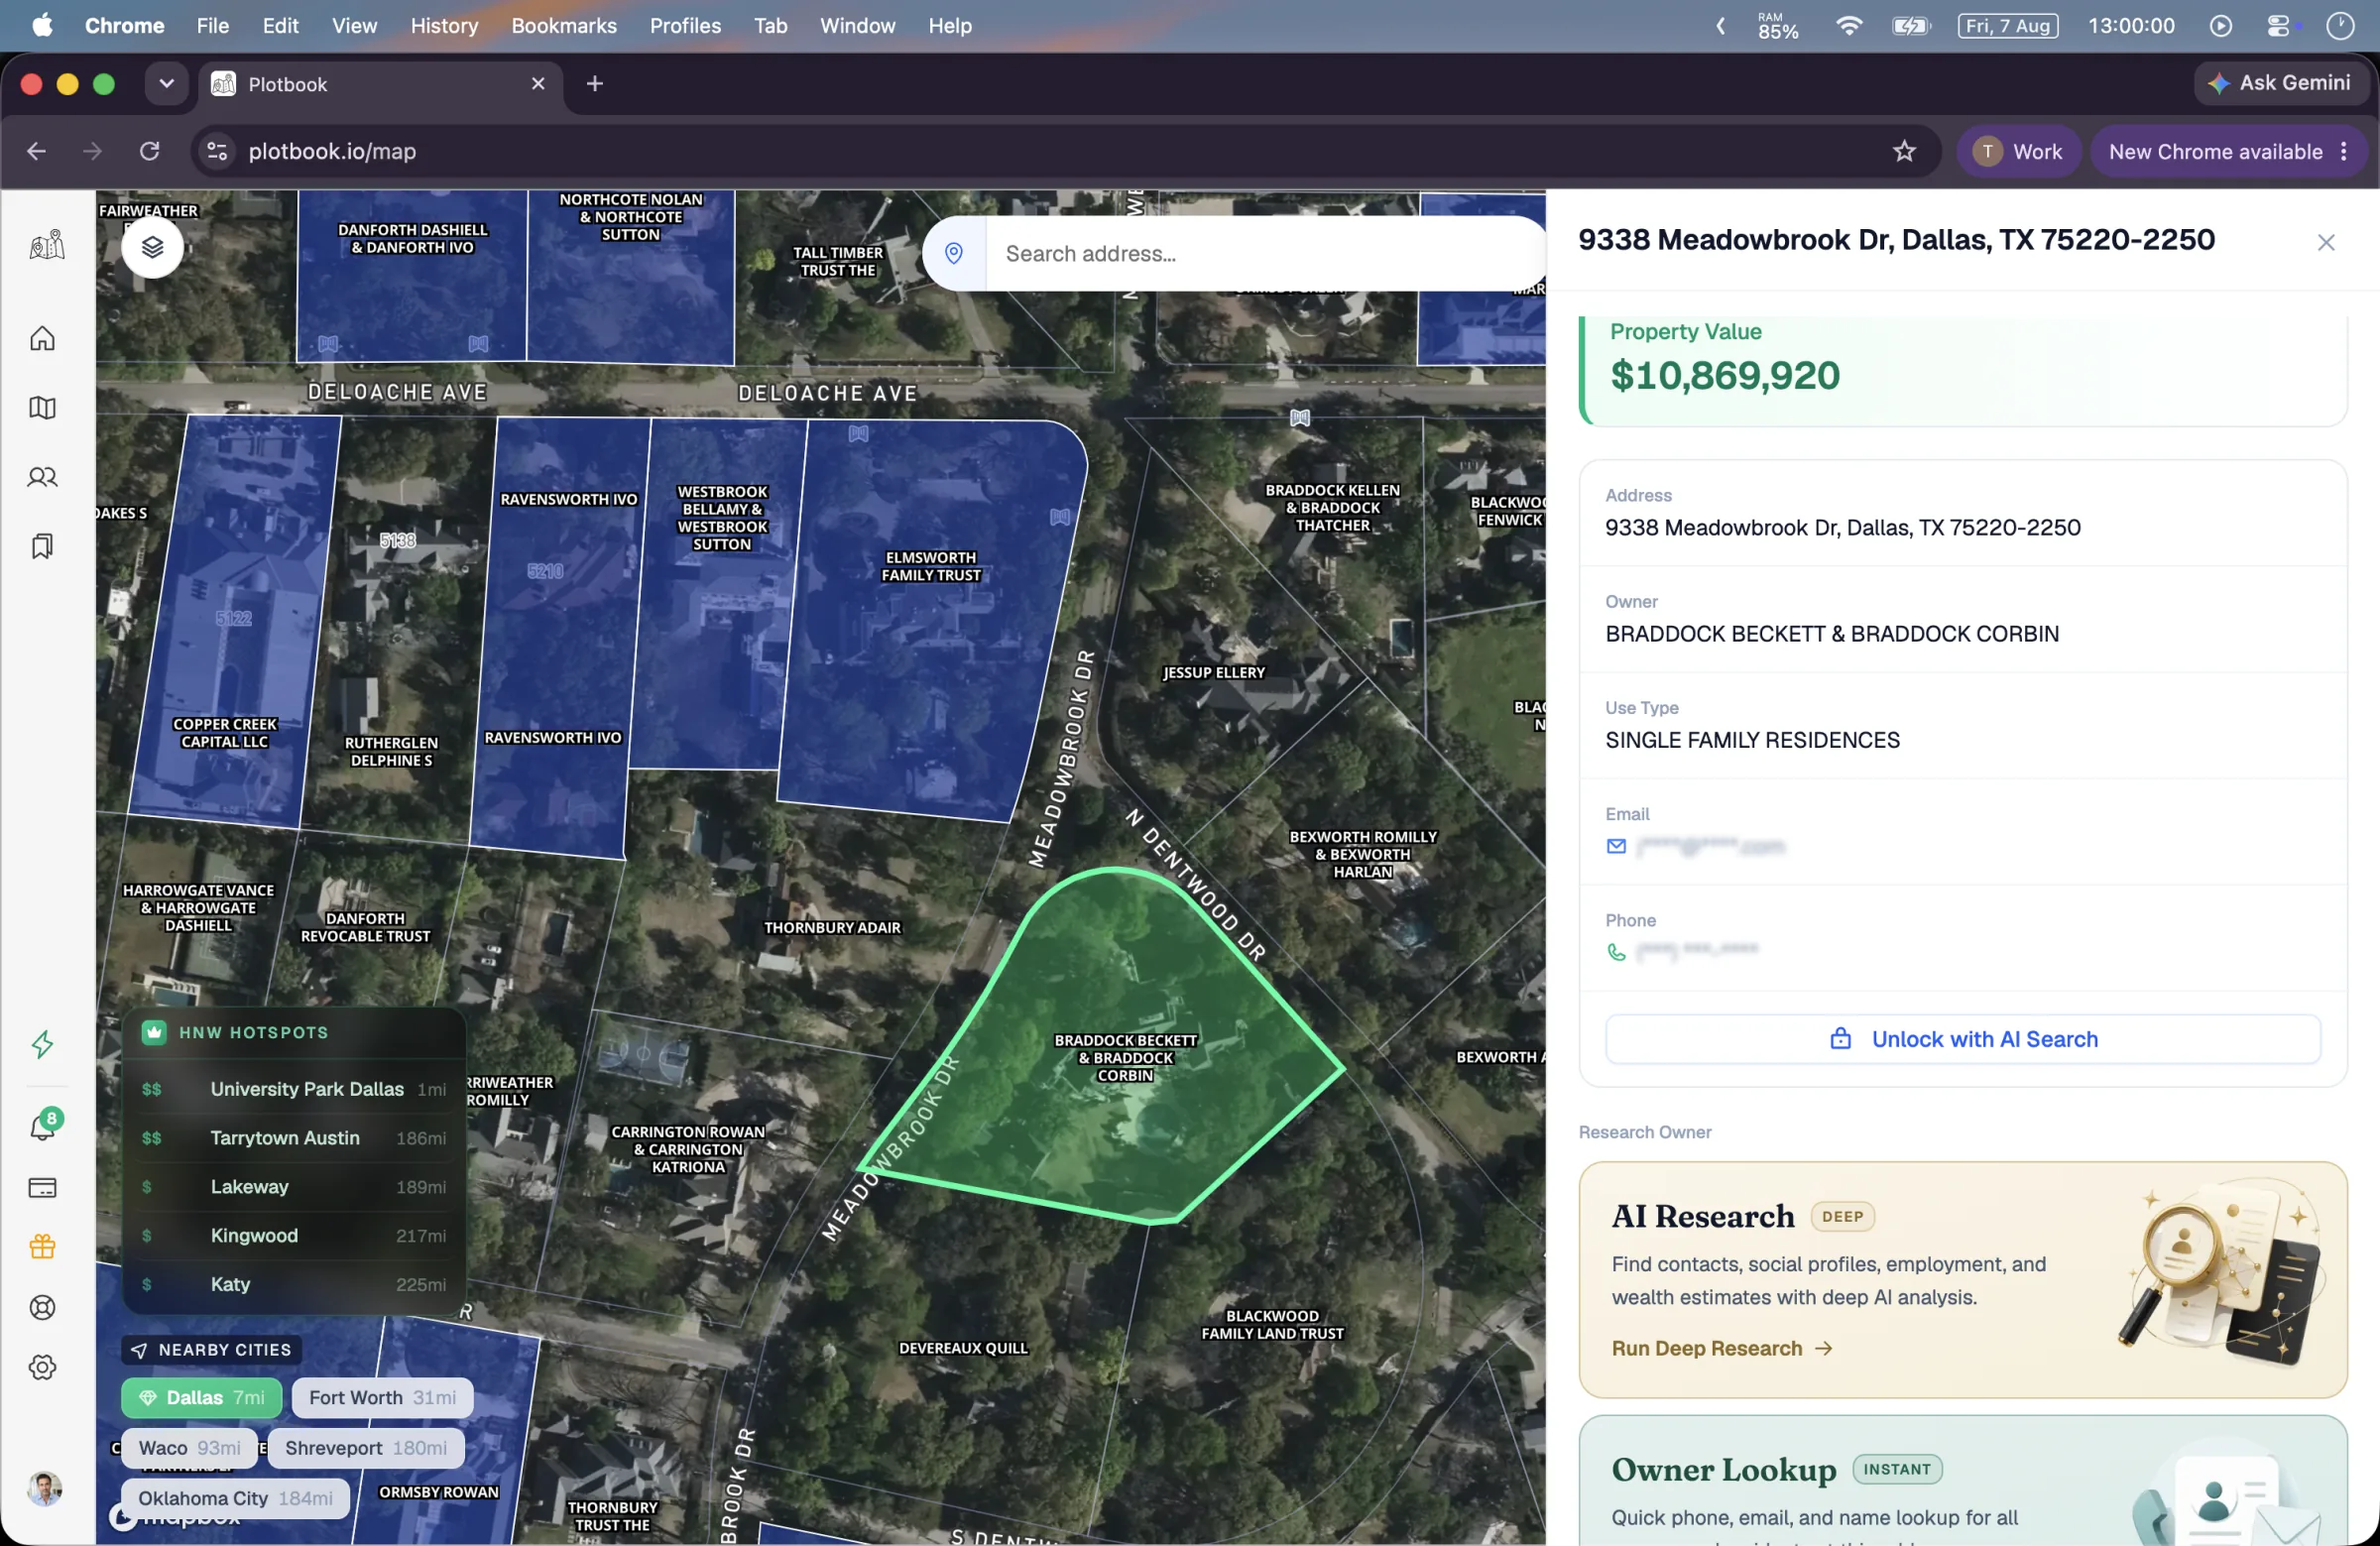
Click a parcel to open the drawer: assessed value, full address, owner of record, and use type. Free, as often as you like.
The selected parcel gets a bright border and a translucent fill so you never lose it while the drawer is open, and the address is copyable straight out. Four fields is a deliberately short list, and it is the honest one — there is no lot size, square footage, or year built in the map drawer, so do not plan around them being there.
What you are doing at this point is triage, and it has two outputs. First, is the value real and is the property genuinely in scope. Second, and more consequential, does the deed name a person or an entity — because those two go down different paths, at different prices, in every run that follows this one.
If you already have saved profiles with linked properties, they show as green markers on the map, so a territory you have worked before visibly fills in over time. That is usually the point at which the map stops being a research tool and starts being a record of your own coverage.
- Drawer fields: assessed value, address, owner of record, use type.
- Everything above is unbilled. The first credit in the wider loop is the 5-credit instant owner lookup on a person-named deed.
- Value and owner rows are locked for accounts without an active subscription.
What one pass costs
This one is free
Unusually for a runbook, there is no arithmetic to do. Every action in the four steps above is unbilled, and the table exists mainly to mark where the free part ends and the next run begins.
A full pass over one market: choosing it from the hotspot layer, filtering to parcels above $1M, and reading every parcel that clears the threshold.
- Searching for a city, ZIP, or address
- Free
- Place search with your last ten searches kept locally.
- Panning, zooming, and switching basemaps
- Free
- Three basemaps including satellite, plus the reset-view and geolocate controls.
- The wealth hotspot layer
- Free
- The heatmap, the graded clusters, the area labels, and the nearby-areas widget.
- Filtering by assessed value
- Free
- All five presets, toggled freely and persisted across sessions.
- Reading deed owner names
- Free
- Every parcel from zoom 16, plus the large-holding labels from zoom 14.
- Opening any number of parcels
- Free
- Assessed value, address, owner, and use type, for as many parcels as you want to open.
- Total
- Free
- Nothing in this run is billed on any plan.
The credits start on the next run, not this one: an instant owner lookup on a person-named deed is 5, a deep research run on an entity-named deed is 25 and is charged only on success, and unlocking a person from a lookup is 5, with the save itself free. Which is the argument for doing this run properly first — every parcel you rule out here is a lookup you do not buy later.
Where it goes wrong
Four ways a map misleads you
A colored map is persuasive in a way a spreadsheet is not, which makes knowing its failure modes more important rather than less.
The assessed-versus-market gap
In states with assessment caps or infrequent reassessment, a long-held property can carry a figure far below what it would sell for, while a recently traded one nearby reads high. The map is showing you the tax roll faithfully. The tax roll is not the market.
Bands are absolute, markets are not
The $1M to $5M band means the same thing everywhere, which means it means something different everywhere. In one metro it is the top of the market and in another it is a starter home. Set your threshold against the market you are reading, not against the band names.
The unknown band hides real properties
Parcels with no published assessed value are drawn in their own band rather than assumed to be cheap. They are easy to filter past and occasionally they are the most interesting record on the block.
A deed owner is not a resident
The name on the parcel is the name on the deed, which may be a trust, a company, a relative, or an owner who lives three states away. The map is authoritative about the deed and says nothing about who sleeps there — that is what the lookup and research runs are for.
Variations
Reading for something specific
The same four moves, pointed at a different question.
- 01
Looking for absentee owners
Work the higher bands and open parcels looking for owner names that read as out-of-area, then check them individually. Absentee ownership is one of the more reliable signals of a second home or an investment holding, and it is also what makes the deeper research run more likely to succeed.
- 02
Looking for assembled land
Use the zoom 14 to 16 window where the large-holding labels appear, and watch for the same owner name repeating across adjacent parcels. That pattern is visible on the map in a way it simply is not in a list of addresses.
- 03
Scouting a market you do not work yet
Start from the nearby-areas widget rather than from a guess, and remember the state licensing constraint before you get attached to a market you are not licensed for. Additional states are available as an add-on.
- 04
Reviewing ground you have already covered
Turn on the saved-properties layer. Profiles you have saved with a linked parcel appear as green markers, so the gaps in your own coverage become visible as gaps rather than as something you have to remember.
Questions
What people ask about this run
Keep reading
Property data
Where the parcels come from, how current they are, and what the bands mean.
Build a lead list
What to do with the shortlist this run produces, priced end to end.
The wealth map
The feature page, with the map shown in motion.
Free tools
Smaller property-record questions, answerable with no account at all.
Open the map on your own street
The whole run above is unbilled, so the honest first test is to read a block you already know and see whether the values and the names match what you would have said.
New subscribers start with 7 days and 100 credits. We email you before the trial ends.