Every polygon on the Plotbook map started as a filing at a county assessor or recorder office: a boundary survey, a deed, an assessment roll. Nothing about that is secret, and nothing about it is convenient. This page explains how those filings become a national map you can read at a glance, what each field on a parcel actually means, and the points where the data stops being able to answer your question.
Plotbook does not maintain its own property database. It uses nationwide parcel data from Regrid, which aggregates and standardizes assessor and recorder records from county governments across the United States, covering 150M+ parcels. Those parcels arrive in your browser as vector tiles through a Cloudflare proxy Plotbook runs, get painted by assessed value in six bands, and print the name on the deed directly on the parcel once you are zoomed in far enough to read it. Opening a parcel fetches its full record and caches it, which is what lets a researched owner reappear on the map later as a saved marker.
Nationwide parcel data from Regrid, covering 150M+ US parcels
Boundary, deed owner name, assessed value, and use type are all public county record
Six assessed-value color bands and five filter presets, both persisted between sessions
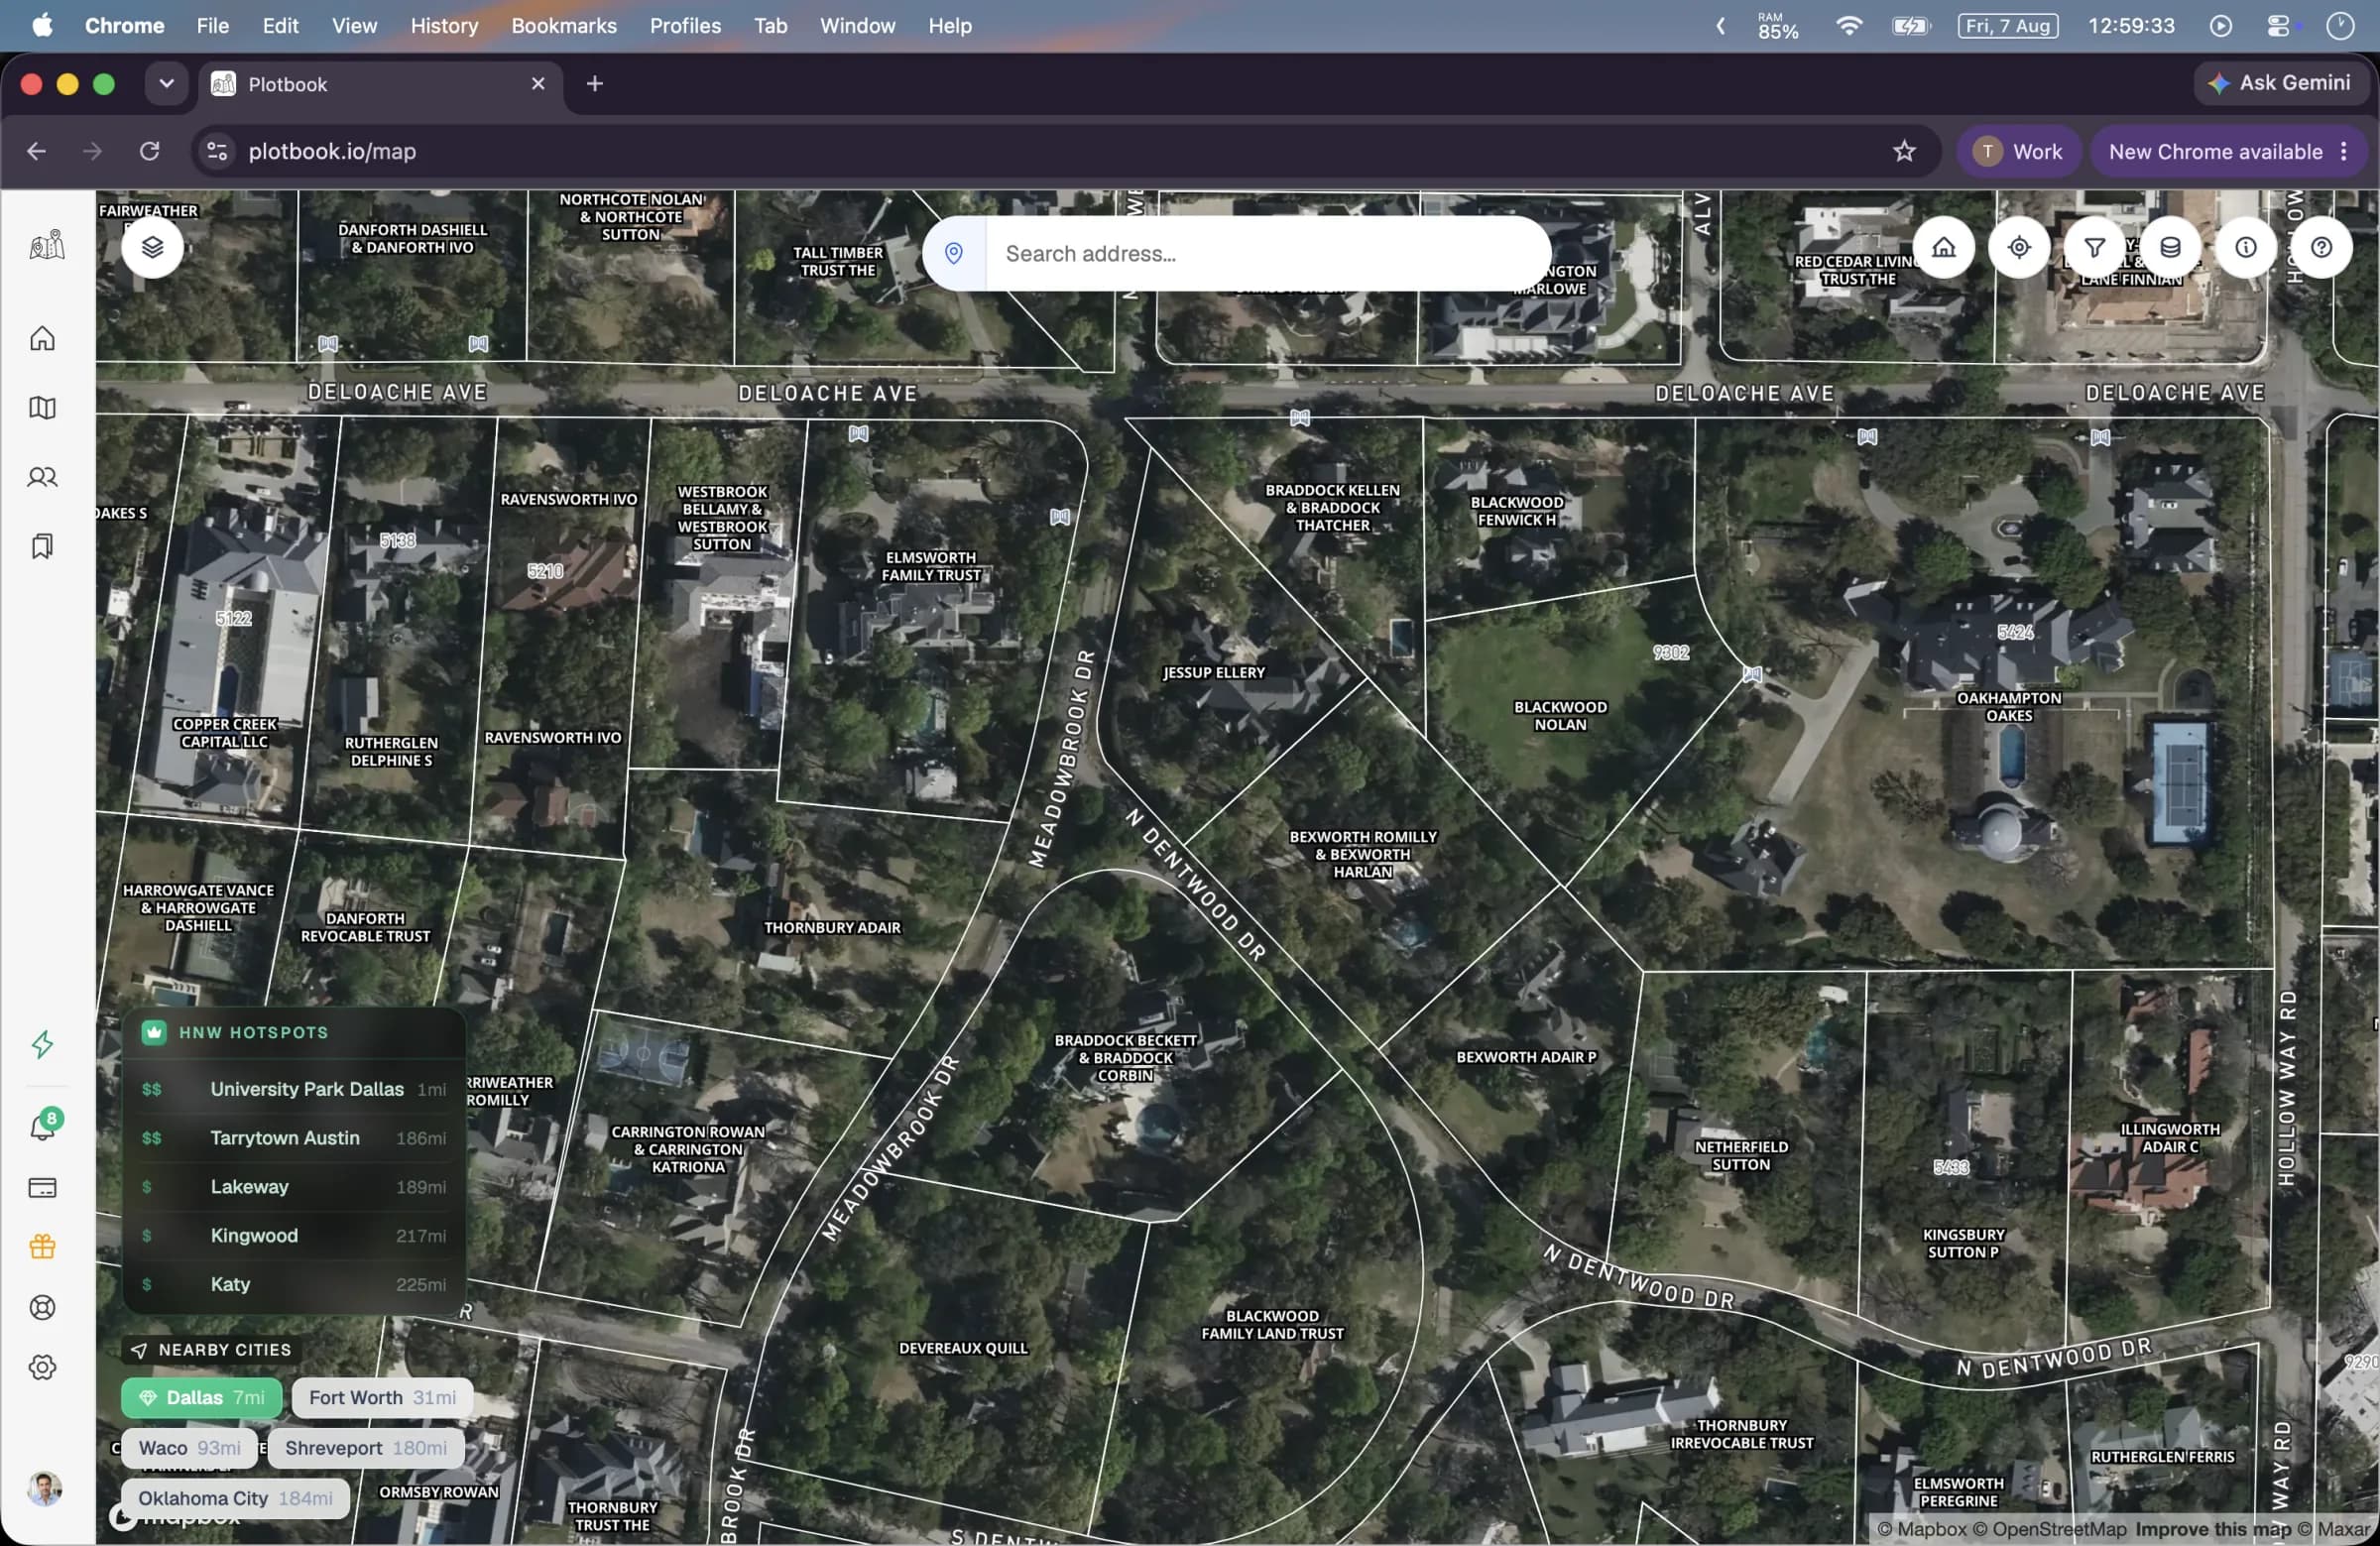
Parcels draw from zoom 14, deed owner names print on them from zoom 16
Parcel detail is cached in Postgres against Regrid's stable parcel id
United States only, and assessed value is not an appraisal
One national dataset instead of three thousand websites
Property ownership in the United States is recorded county by county. Each county assessor values the land and improvements for tax purposes, each county recorder registers the deeds that transfer them, and each publishes some version of that record, on some schedule, in some format. The information is public, and it is also scattered across thousands of separate systems with no common field names, no common geometry, and no common idea of what a parcel identifier looks like.
Regrid does the reconciliation. It collects those county records, normalizes them into one schema, attaches the surveyed boundary geometry, and assigns each parcel a stable identifier that Plotbook can cache against. Plotbook consumes that dataset rather than rebuilding it, which is a deliberate choice: parcel aggregation is a full business on its own, and doing it badly is worse than not doing it.
What arrives per parcel is the boundary polygon, the name on the deed, the address the tax bill is mailed to, the county's assessed value, the use description, the parcel number, zoning, property class, and a coordinate. Those fields are the raw material for everything else in the product. The map colors by the assessed value. The owner label prints the deed name. The research agent starts from the deed name and the mailing address. None of it is inferred.
Boundary geometry, so parcels are shapes rather than pins
Deed owner name, printed on the parcel and used as the research starting point
Assessed value, which drives the color bands and the value filter
Mailing address, which is how absentee ownership is detected
Use description, parcel number, zoning, and property class
Vector tiles through a proxy that holds the key
Parcels are delivered as vector tiles rather than pre-rendered images. A tile is a compact packet of geometry and attributes, so the browser receives the shapes and the data together and draws them itself with WebGL through Mapbox GL. That is why the boundaries stay sharp at any zoom, why hovering a parcel can highlight it instantly, and why changing the value filter repaints the view without another round trip to a server.
Those tiles do not come straight from the tile vendor. They pass through tiles.plotbook.io, a Cloudflare Worker Plotbook operates, and the credential for the upstream tileserver lives only in that worker's secrets. A browser session never holds a key that could be lifted and reused, and the worker caches tiles at the edge so a market that somebody already explored loads from a nearby datacenter rather than from origin.
Zoom controls how much the map is willing to tell you at once. Parcels start drawing at zoom 14, roughly a neighborhood. Every parcel gets its deed owner label at zoom 16, close enough that the names have room to sit inside their boundaries. Between those two levels, an overlay labels only the large holdings early and sorts by value, so when two labels compete for the same space the more valuable parcel keeps its name.
Six bands, so a region reads in one glance
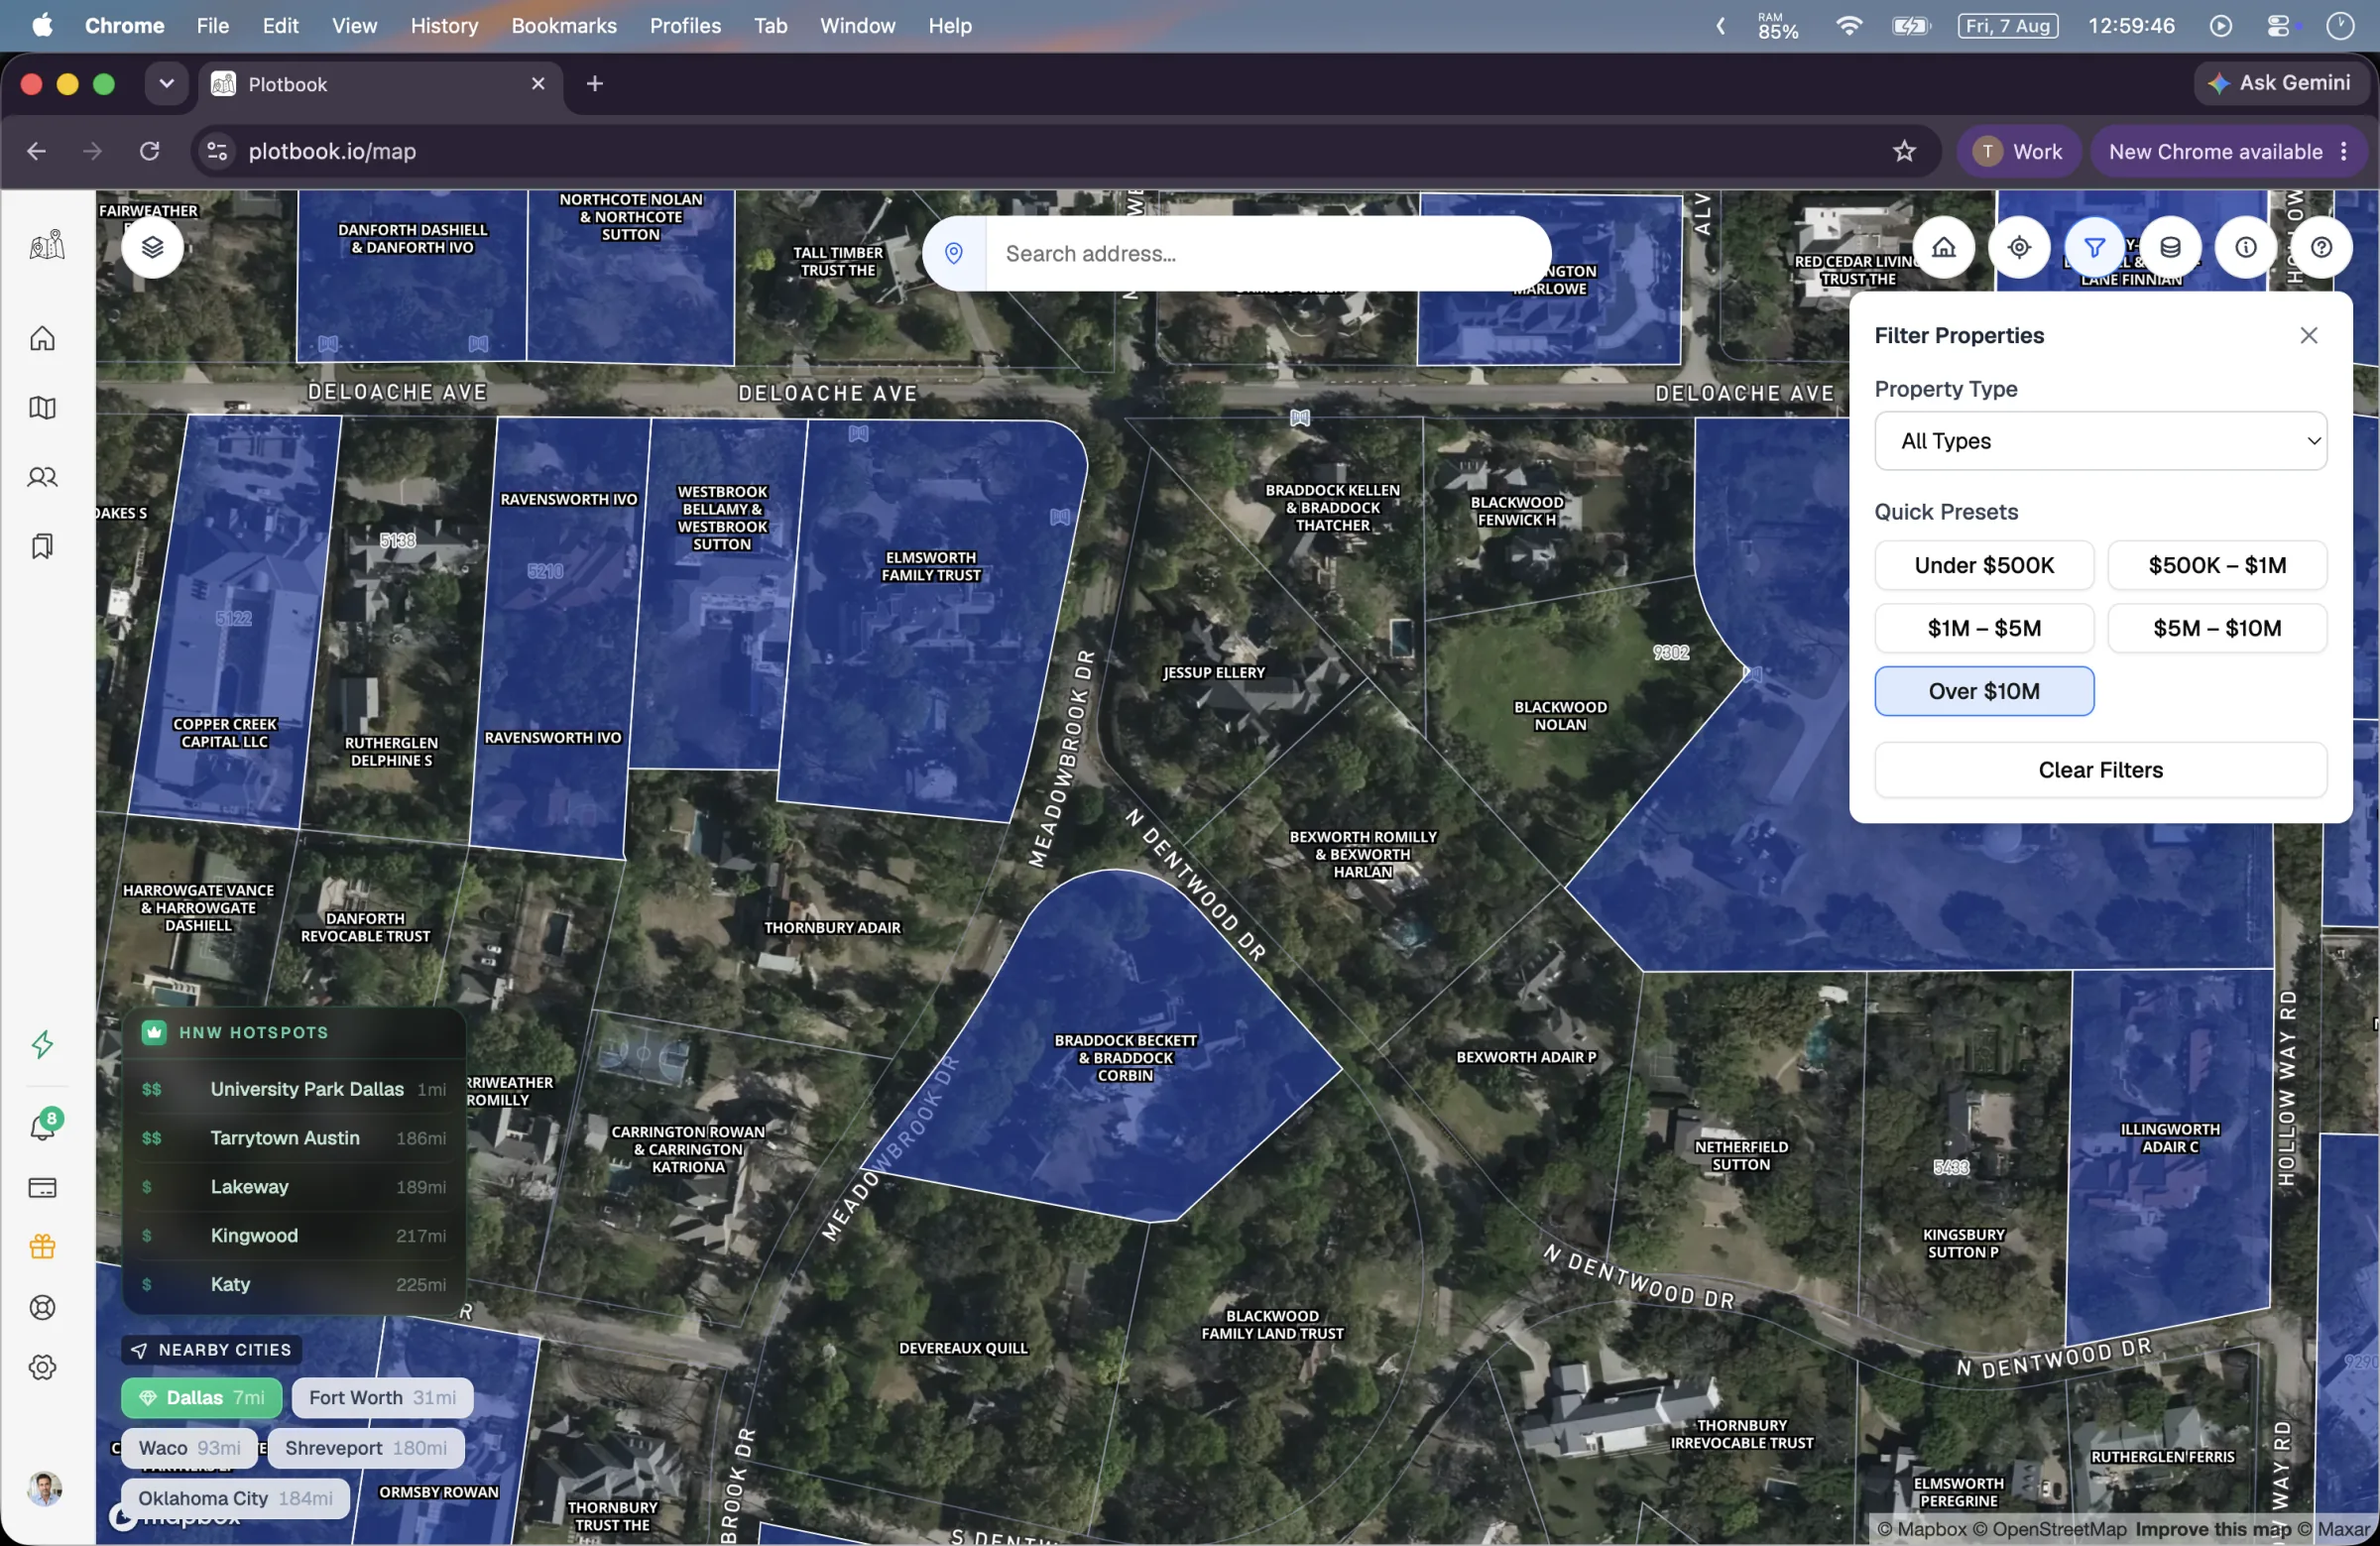
Each parcel is filled by its assessed value in one of six bands: unknown, under $500K, $500K to $1M, $1M to $5M, $5M to $10M, and over $10M. The bands are deliberately coarse. The purpose is not to read a number off a color, it is to make the shape of a market visible from altitude, so waterfront, the ridge behind town, and the one street where the older estates sit separate themselves before you have clicked anything.
The same six bands drive the filter. Five quick presets narrow the view to a tier, and filtered parcels are painted out rather than removed: they keep a dimmed outline and stay clickable, so you can see that the filter is hiding something and still open it. Both the filter and the legend state persist between sessions, because most people work one market repeatedly and should not have to rebuild their view every morning. A palette control turns the color off entirely when you want to look at the ground instead.
Three basemaps sit under all of it, Mapbox Satellite plus outdoor and hybrid styles from MapTiler, which matters more than it sounds: satellite imagery is how you tell a large lot from a large house, and a hybrid view is how you keep street names while doing it.
Unknown, under $500K, $500K to $1M, $1M to $5M, $5M to $10M, over $10M
Five filter presets matching the bands, toggleable and persisted
Filtered-out parcels stay visible as dimmed outlines and remain clickable
Colors can be switched off entirely from the legend
232 hotspots that are curated, not computed
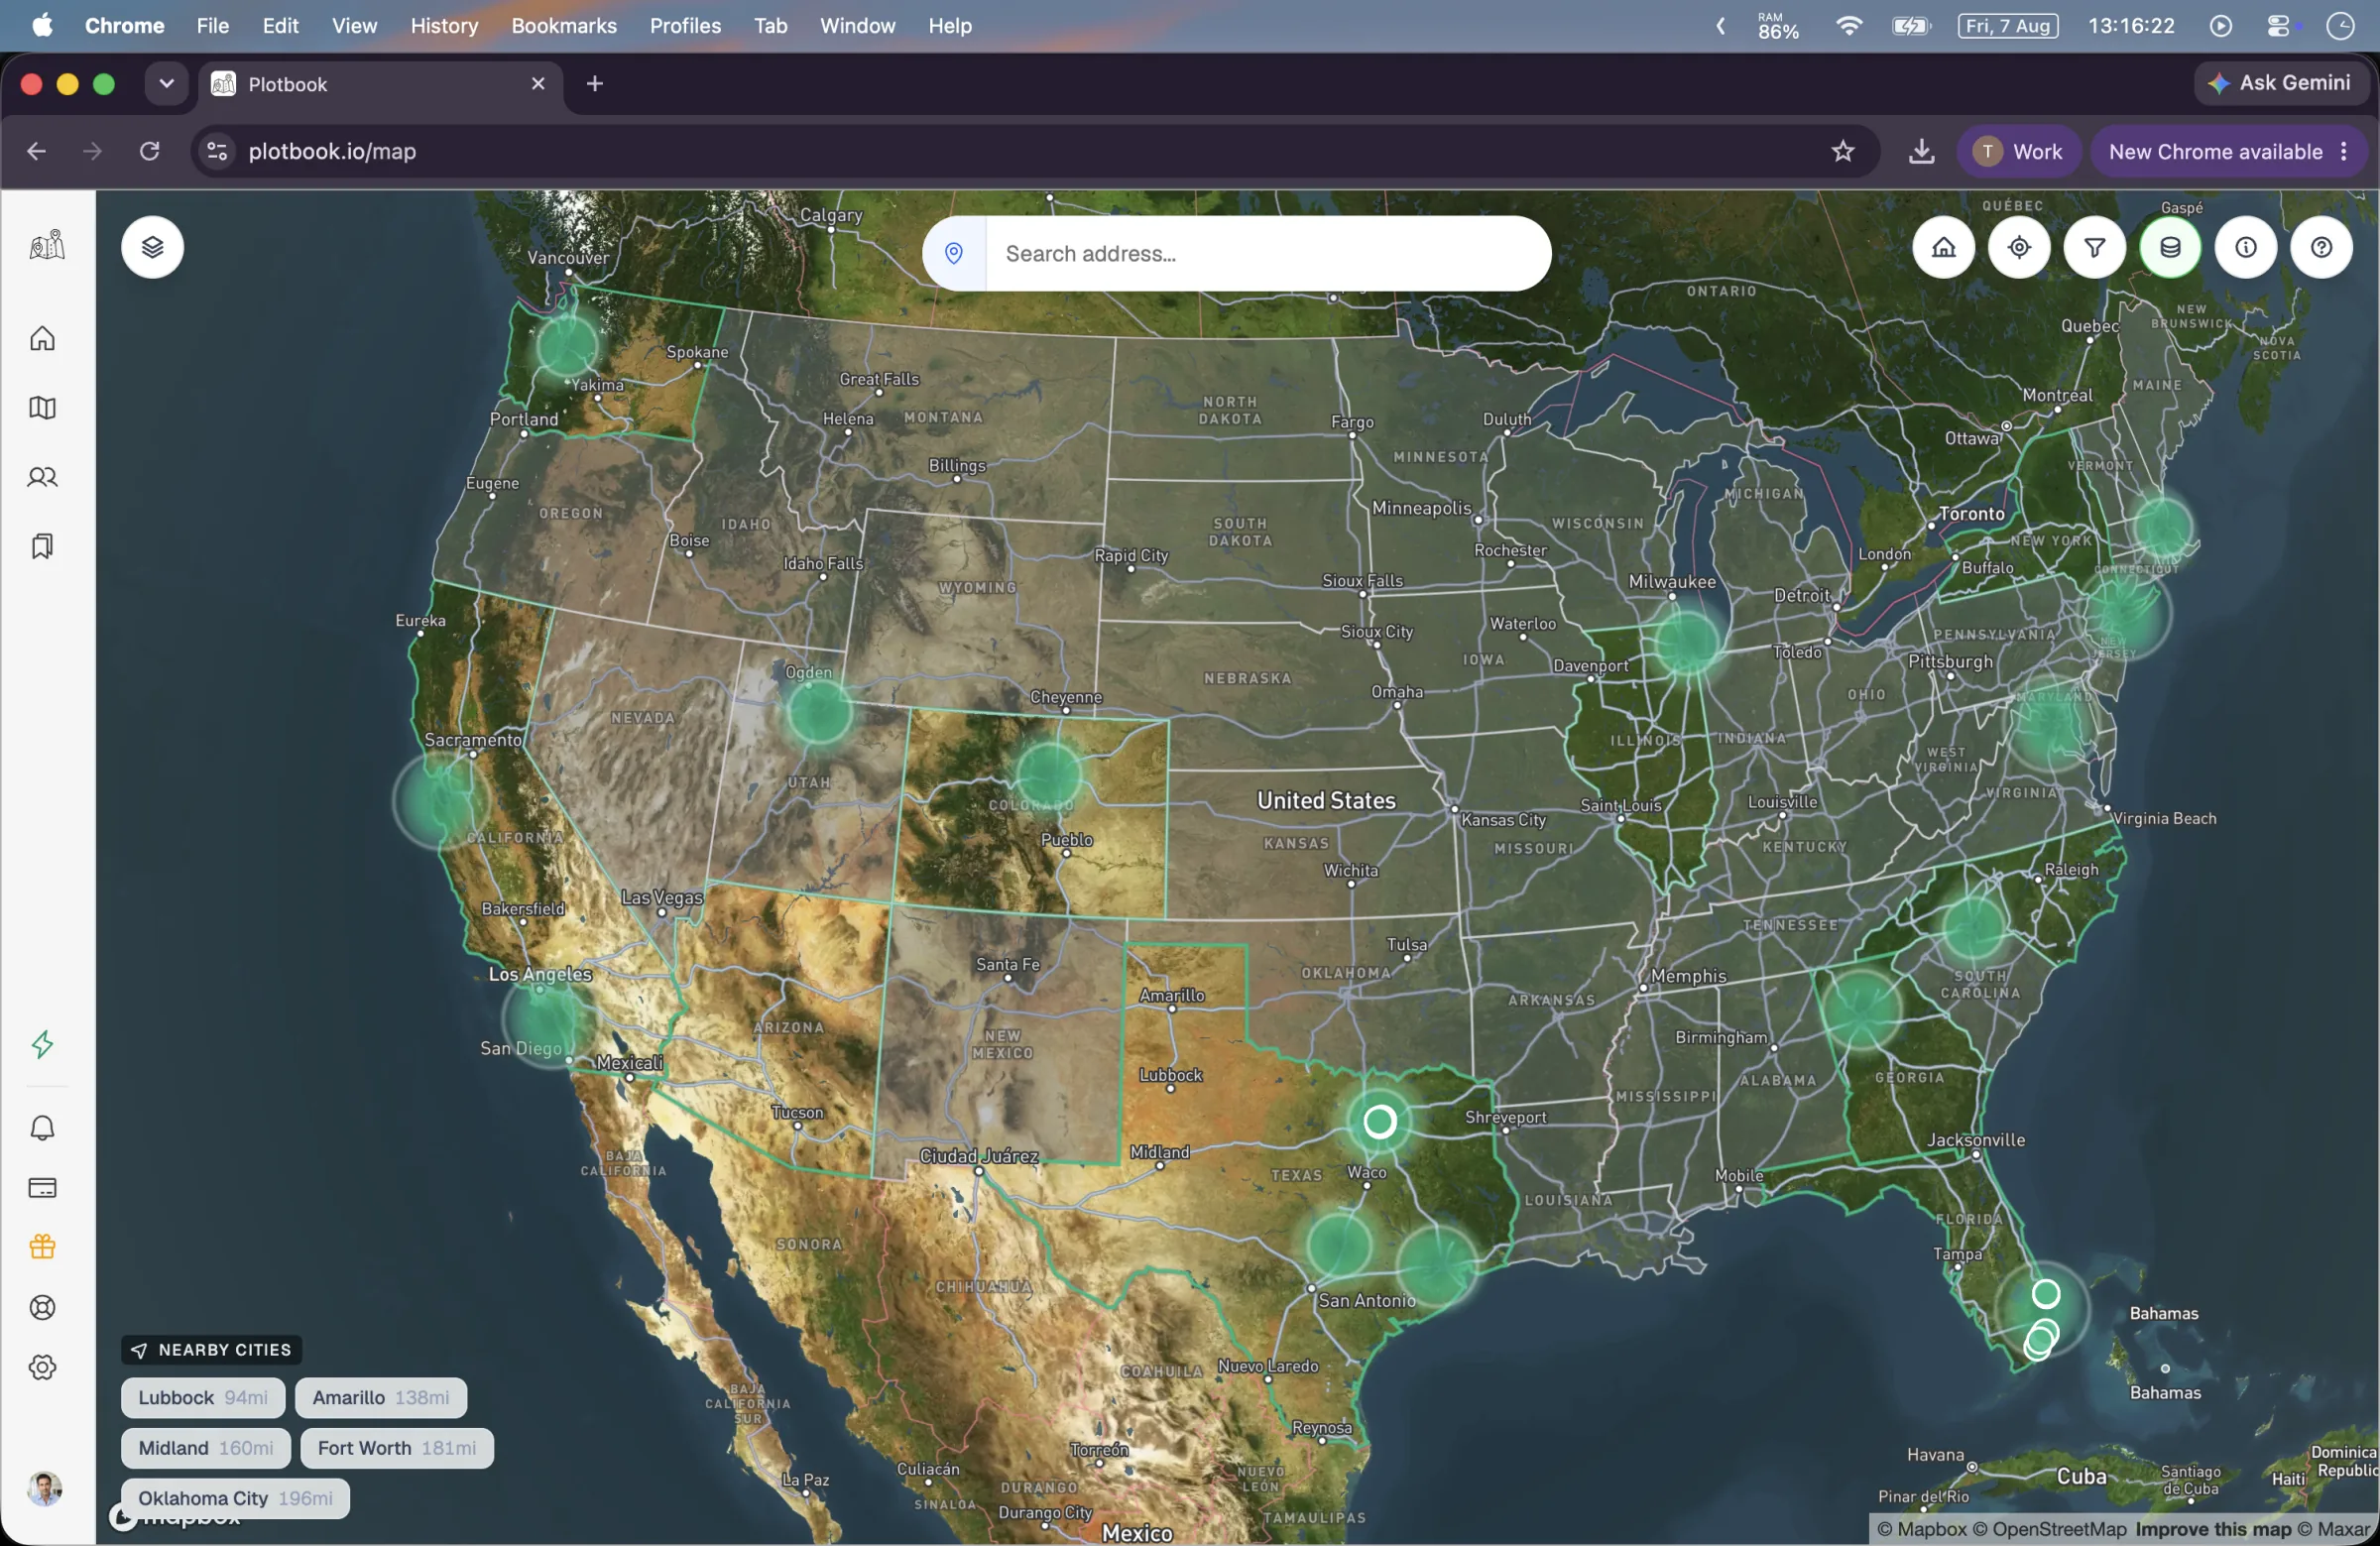
Zoomed out, parcel geometry is useless: at state scale there is nothing to see but a solid wash. So above the parcel layer sits a separate dataset of 232 hand-curated high-net-worth ZIP codes, the Fisher Islands and Athertons and Palm Beaches, rendered as a heatmap at country and state zoom, as clickable clusters through the middle zooms, and as individual pulsing badges with area names as you come down toward a neighborhood. A side widget lists wealthy areas near wherever you are currently looking.
It is worth being precise about what that layer is, because this is exactly the sort of thing the category tends to dress up. It is a curated list of postal codes with density tiers, not a computed measure of household wealth, and no figure shown on it is derived from the individual households inside those ZIPs. Its job is orientation: it tells you where to zoom in when you are working an unfamiliar state. Everything below it, the parcels and the names, is the actual record.
What a single parcel will tell you
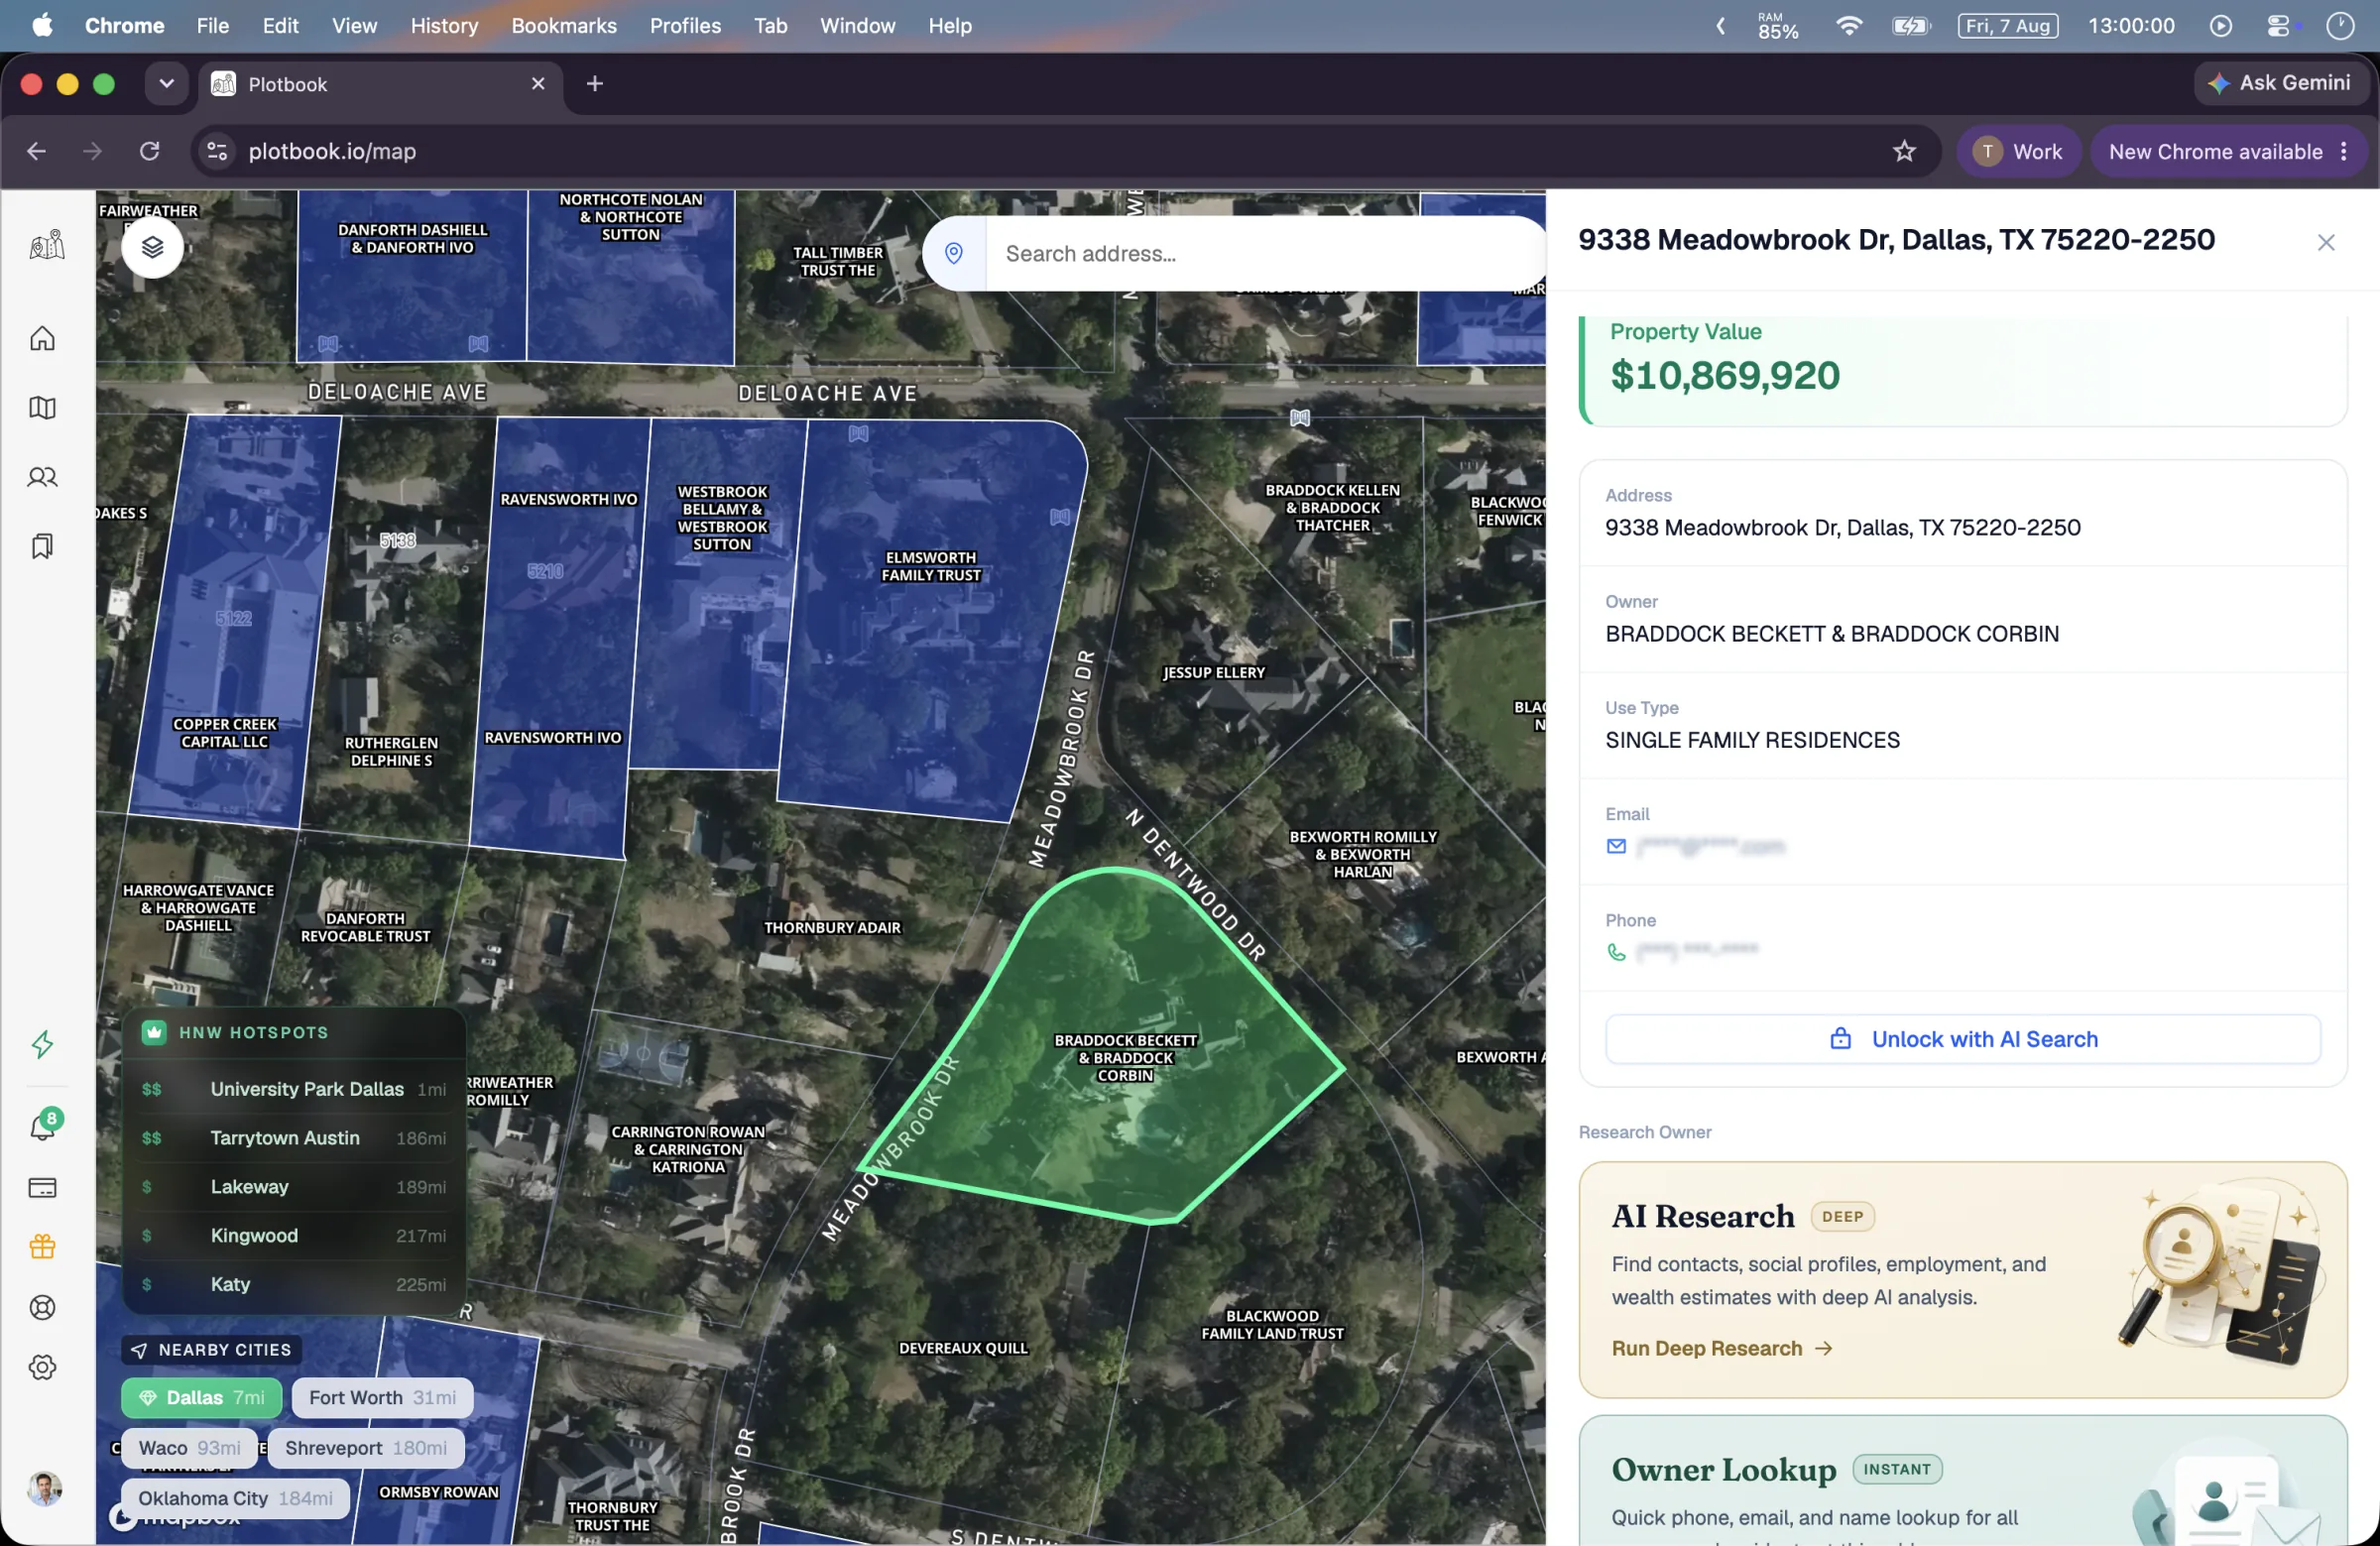
Clicking a parcel opens a drawer with the assessed value, the address, the name on the deed, and the use type. That is the county's view of the property and it is where public record stops. Contact rows appear in the drawer but stay masked, because a phone number is not a county record and has to be retrieved from somewhere that charges for it.
From there the drawer offers the two ways forward, and they are different in kind. An instant owner lookup queries residential records for the people at that address, which is the right move when the deed names a person and you want their household in a few seconds. Deep research hands the property to the AI agent, which is the right move when the deed names an LLC, a trust, or a partnership and there is no person to look up yet.
Once a profile exists for that property it links back: the parcel keeps a green marker on the map, and the drawer shows the owner's name, wealth estimate, and unmasked contacts instead of the research buttons. The map stops being a lookup surface and starts being a record of what you have already worked.
Cached against a stable id
Tiles are streamed and not stored. Parcel detail is different: when you open a property, its record is written to Plotbook's Postgres database keyed by Regrid's stable parcel identifier, along with the full original response, so a field that is not surfaced in the UI today can be surfaced later without re-fetching anything.
Each cached parcel also stores its location as a PostGIS point with a spatial index. That is what makes the map's saved layer possible: as you pan, Plotbook can ask which of your saved profiles have properties inside the current viewport and return them as markers, in one indexed query rather than by scanning your whole prospect book.
The practical effect is that repeat work is fast and does not re-spend anything. Reopening a parcel you have already opened serves from cache. Re-running research on a property you have already researched returns the profile you already own rather than starting a second billable run.
Assessment cycles, not a live feed
Property data moves at the speed of county government, and that speed varies. Assessors reassess on their own cycles, some annually and some every few years. Deeds appear in the record after they are filed, which happens after closing, not at it. Regrid refreshes counties on a rolling basis and Plotbook shows what Regrid has. Nobody in that chain is streaming, and any product that claims a live view of ownership is describing something that does not exist.
This matters most for the case people care about most: a property that recently changed hands. A sale shows up once the deed is recorded and the county publishes it, which is a matter of weeks in most jurisdictions rather than days. If your workflow depends on reaching new owners within days of closing, that is a genuine gap and worth knowing before you build around it.
The other freshness question is assessed value against market value. An assessment is a tax figure produced on a cycle, and in a moving market it will lag, sometimes by a wide margin, in either direction. It remains an excellent relative signal: within one county, a parcel assessed at $6M and one assessed at $400K are not in the same conversation regardless of what either would actually fetch. Read it as a tier, not as a price.
Deeds are public by design
Land ownership is recorded publicly because the system depends on it being verifiable. A deed only protects a buyer if anyone can check who holds title, which is why assessment rolls and recorder indexes are open to any member of the public. Looking up who owns a property requires no consent, and building a map of it changes the convenience, not the legal status.
What Plotbook adds to public record is aggregation and visualization. What it does not do is scrape private information. Contact details are a separate layer entirely: they come from licensed data providers under their terms, they are masked until you deliberately spend a credit to retrieve them, and they are never part of the parcel record itself. That separation is intentional, and it is the line worth understanding when a compliance team asks what the map actually is.
End to end
From a county filing to a colored parcel
Five stages sit between a clerk recording a document and you seeing a name on a rooftop. Each one is a place where the data can be stale or thin, which is the honest reason to understand the chain rather than trust the picture.
01
A county records it
An assessor sets a value on its cycle and a recorder registers deeds as they are filed. This is the origin of every number and every owner name in the system, and it is why the data has a county's cadence rather than a software product's.
02
Regrid standardizes it nationally
Records from county systems are reconciled into one schema with boundary geometry attached and a stable identifier per parcel, producing nationwide parcel data covering 150M+ properties.
03
Plotbook's proxy serves the tiles
Vector tiles pass through a Cloudflare Worker that holds the upstream credential and caches at the edge, so the browser gets geometry and attributes together without ever holding a key.
04
The browser paints and labels it
Mapbox GL fills each parcel by assessed value in six bands, draws parcels from zoom 14, prints deed owner names from zoom 16, and labels large holdings earlier with the highest-value parcels winning collisions.
05
Opening one caches it
The full parcel record is fetched, stored against Regrid's identifier with its original payload, and indexed as a PostGIS point, which is what powers saved-property markers and makes reopening it free.
The specifics
Numbers you can check
Everything on this page in the form that is easiest to argue with. If a figure here disagrees with something else on the site, this table is the one that was written against the code.
Parcel coverage
150M+
Nationwide US parcel data from Regrid. Coverage is Regrid's, not proprietary to Plotbook, and it is United States only.
Assessed-value bands
6
Unknown, under $500K, $500K to $1M, $1M to $5M, $5M to $10M, over $10M. Toggleable from the legend.
Value filter presets
5
One per value band above unknown. Persisted between sessions along with the rest of the map state.
Parcels visible from
Zoom 14
Deed owner names print on every parcel from zoom 16. Large holdings are labeled earlier, sorted so the highest value wins a collision.
Basemaps
3
Mapbox Satellite, plus outdoor and hybrid styles from MapTiler.
Curated HNW ZIP codes
232
A hand-built list rendered as a heatmap, clusters, and badges. Density tiers only, never per-household wealth.
Address search results
Up to 10
Mapbox geocoding from two characters, covering addresses, cities, and ZIPs, with your last 10 searches kept locally.
Cost to read the map
0 credits
Panning, filtering, and reading the deed owner names printed on the parcels are included. Opening a parcel nobody has looked up yet costs 1 credit and caches it for good; after that it reopens free. Retrieving people is where the real cost sits: 15 for an instant owner lookup, 25 for a research run.
Plans license a set number of states, one on Starter, two on Professional, and five on Enterprise, with additional states available as a $49 add-on, because most people using this work a defined geography rather than the whole country.
Where it stops
What the parcel layer cannot tell you
Six things people reasonably expect from a property map that this one genuinely does not do. Better to find them here than three weeks into a workflow.
It does not filter by property type
Assessed value is the only filter on the map. There is no working residential or commercial narrowing, so a mixed corridor has to be read by eye or by opening parcels.
You cannot search the map by owner name
The search bar takes addresses, cities, and ZIP codes. If you have a name and no address, that is a job for people search rather than for the map.
It is not an appraisal or a comp
Assessed value is a county tax figure on a county cycle. There is no MLS data, no sale comparables, no mortgage or lien information, and no estimate of what a property would sell for.
The drawer is not a full property report
Value, address, owner, and use type appear on the map. Lot acreage and building area show up on a saved profile's property card, not in the map drawer, and construction detail is not part of the product at all.
Hotspots are curated, not measured
The 232 high-net-worth ZIP codes are a hand-built orientation layer. Nothing in it is derived from the households inside those ZIPs, and it should never be read as a wealth figure.
United States only
Parcel data, residential records, and the contact databases are all US. There is no international coverage and none planned in a way worth promising.
The fastest way to judge parcel data is to point it at a neighborhood you can check from memory and see whether the names and the values match what you already believe.