Plotbook vs Windfall
Windfall gives you a number. You still need the name
Windfall models household net worth as a precise figure rather than a band and refreshes its data weekly. That is a serious data operation and their presentation is cleaner than ours: a single number is easier to sort a file by than a range. But every one of those numbers is attached to a household you have to bring them. If your problem is that you do not have the households yet, a better estimate does not help. That is the gap Plotbook is built for.
Windfall details from public sources, checked August 2026. Windfall figures below are theirs, from their published material: household-level precise net worth, weekly data refreshes, and use by 1,500+ organizations. They price by quote and publish no rate card. Check the official Windfall product page. Plotbook is the vendor here, so read this as our argument and check it against theirs.
The short answer
Enrichment, or discovery
Windfall is an enrichment and screening layer: it makes records you already hold more useful, at population scale and on a weekly cadence. Plotbook is a discovery tool: it produces records that do not exist yet, one property at a time. Neither substitutes for the other, and the honest test is which end of the pipeline is currently your constraint. If you have plenty of names and poor information about them, Windfall. If you have good information about too few people, Plotbook.
Pick Plotbook if you need new names
- You have a territory rather than a file, and no records to enrich yet.
- You want to see wealth geographically, parcel by parcel, rather than as a scored column.
- You need the person behind an LLC or trust-held deed, which is an identity problem rather than a scoring one.
- You want to see how an estimate was reached, source by source, before you act on it.
- You are an individual or a small team buying on a card, not negotiating a data contract.
Pick Windfall if you already have the records
- You hold a substantial file of households and need every one valued.
- A precise sortable figure suits your workflow better than a range.
- Weekly refresh across the population matters to how you operate.
- You want net worth delivered into your CRM or data warehouse rather than read in an app.
- You are screening at a scale where per-prospect research is not a sensible unit of work.
Neutral ground
What each product actually is
Both get called wealth intelligence. One is a data product, the other is a research tool, and that distinction explains almost every difference below.
Plotbook
A map of US property colored by assessed value, with an AI agent that identifies the owner behind a deed and estimates their wealth in ranges.
- Shape
- An application you work in
- Entry point
- A place on a map
- Wealth output
- Four ranges, net worth, income, investible assets, and total assets, with a confidence score
- Refresh
- Per research run. Nothing updates on its own.
- Scale
- One prospect per run, at 25 credits
- Pricing
- $79 to $499 per month, published, self-serve
Windfall
A people intelligence data provider modeling precise household net worth, refreshed weekly and delivered into customer systems.
- Shape
- A data product you pipe into your systems
- Entry point
- Records you already hold
- Wealth output
- A precise net worth figure rather than a band
- Refresh
- Weekly, across the modeled population
- Scale
- Population scale, with unlimited record screening
- Pricing
- Subscription, quoted per customer
Side by side
Capability by capability, including where we lose
Phrases rather than checkmarks. Rows favouring Windfall are set in darker type on their side, and the first three of them are the ones that should decide the purchase if you already have a file.
| Capability | Plotbook | Windfall |
|---|---|---|
| Valuing a large file of known households | PlotbookNot offered. No upload, no batch scoring. | WindfallThe core product, at population scale |
| Refresh cadence | PlotbookOnly when you pay for a new research run | WindfallWeekly across the modeled population |
| Precision of the wealth figure | PlotbookFour ranges with a confidence score | WindfallA precise figure rather than a band |
| Producing a household you did not have | PlotbookThe core function. Starts from a parcel. | WindfallEnrichment only. Records must come from you. |
| Geographic view of wealth | PlotbookParcel map across six assessed-value bands, plus a hotspot heatmap | WindfallNo map or spatial interface |
| Identifying the person behind an LLC or trust deed | PlotbookEntity classification, then registry, county record, and open-web research | WindfallNot an offered workflow |
| Auditability of a single answer | PlotbookA live timeline of every search and source, kept on the profile afterwards | WindfallA modeled figure; the model is proprietary |
| Contact details | PlotbookEmails and phones per person from contact data providers, masked until you spend a credit | WindfallHousehold and demographic attributes alongside net worth |
| Delivery into your systems | PlotbookCSV export only, on Professional and Enterprise | WindfallCRM integrations and data-platform delivery |
| Getting started | PlotbookCard, 7 day trial with 100 credits, no call required | WindfallQuoted subscription |
| Entry price | Plotbook$79 per month | WindfallNot published |
Windfall figures are theirs, from their published material as of August 2026. They price by quote, so the pricing row says so rather than inventing a number.
Precision and honesty
A precise figure is still an estimate
Windfall's presentation is genuinely better for sorting: a column of single numbers ranks cleanly and a column of ranges does not. If your workflow is ordering ten thousand households by wealth, that difference is real and it is in their favour.
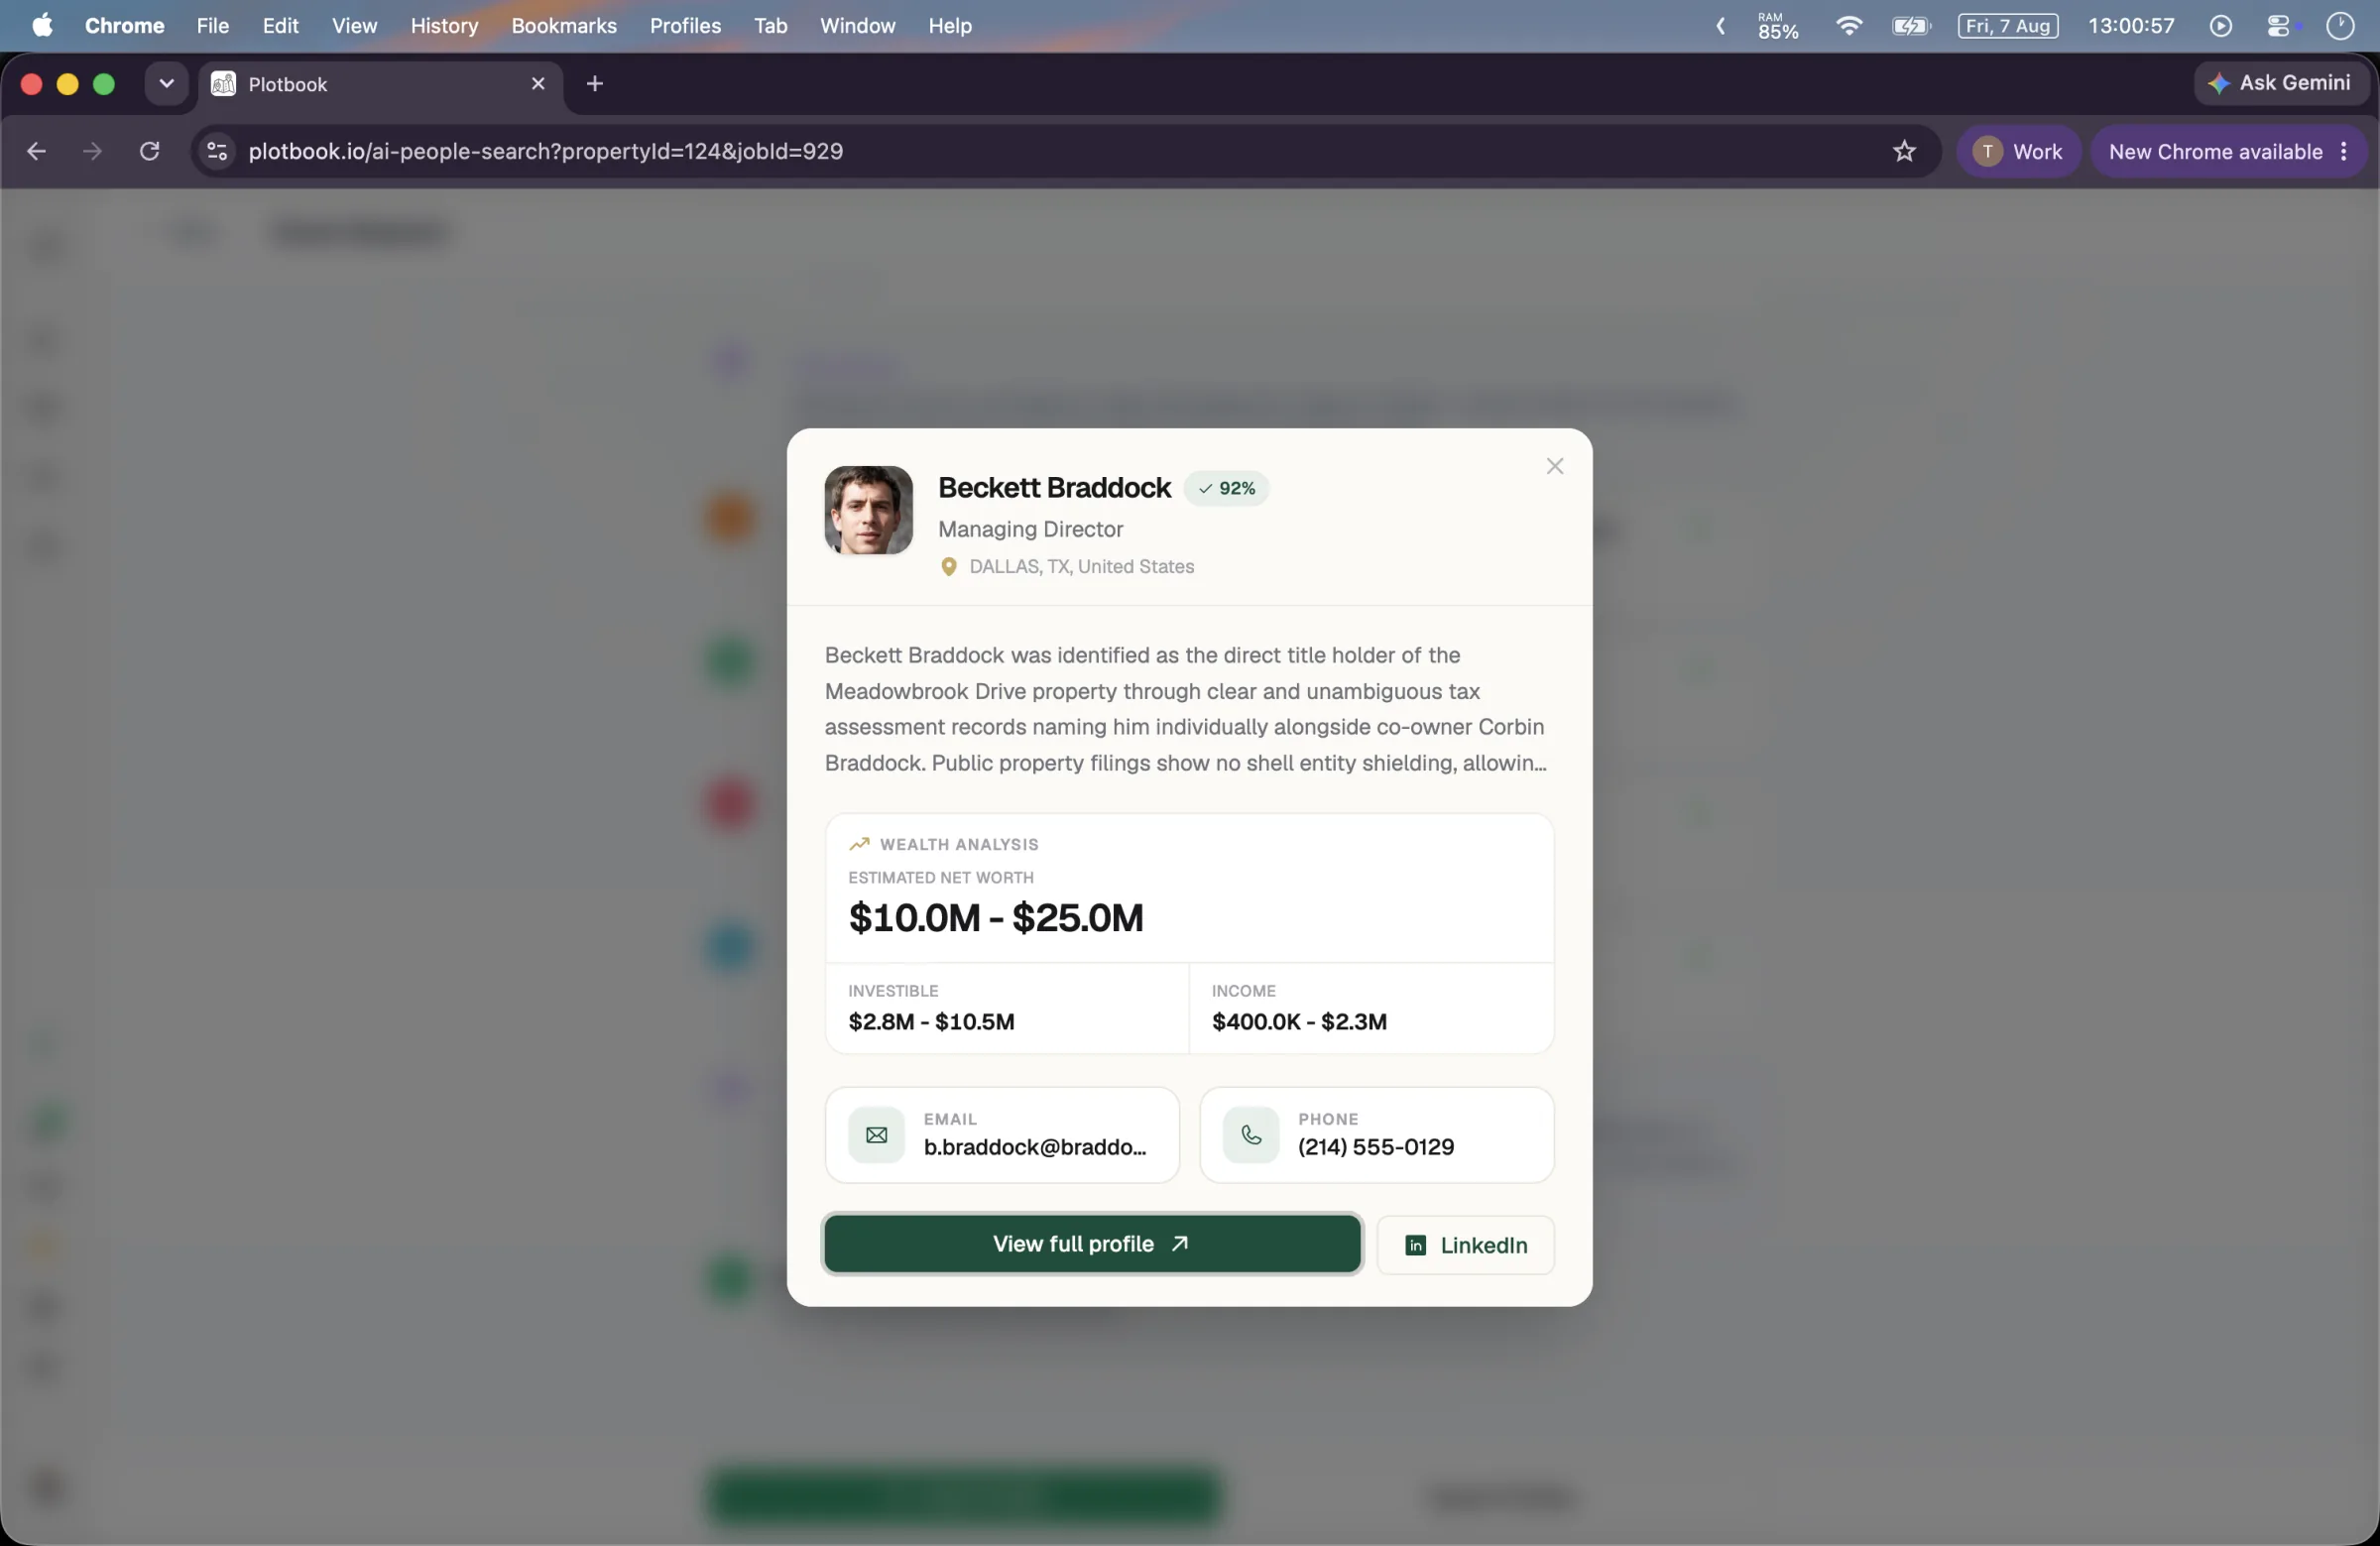
What a point figure does not carry is uncertainty. An $11.8M and an $11.8M that the model is far less sure about look identical in a spreadsheet. Plotbook goes the other way on purpose. Every wealth figure is a range, there are four of them, net worth, income, investible assets, and total assets, and each profile carries a separate confidence score about the identification itself, plus the tier the research run actually reached. A thin answer is meant to look thin.
The other difference is that ours is checkable. Every run keeps its timeline: which registries were queried, which county records were read, which contact databases returned what, and which sources corroborated the identity. If a range looks wrong, you can open the trail and see why the model thought otherwise. That is a different kind of trust from a well-built proprietary model, and for a fiduciary putting a number in front of a client, we would argue it is the more useful kind.
- Four ranges rather than one figure: net worth, income, investible assets, total assets
- A confidence score about the identification, separate from the wealth figures
- A stated research tier, from a full profile down to entity only
- The full source trail kept on the profile after the run finishes
The upstream problem
Enrichment cannot fix an empty list
Windfall's model needs a household to value. That is not a criticism, it is what an enrichment layer is, and it works extremely well when records exist. But it makes the product useless for the specific problem of not having any records, which is the position most independent advisors and small development shops are actually in.
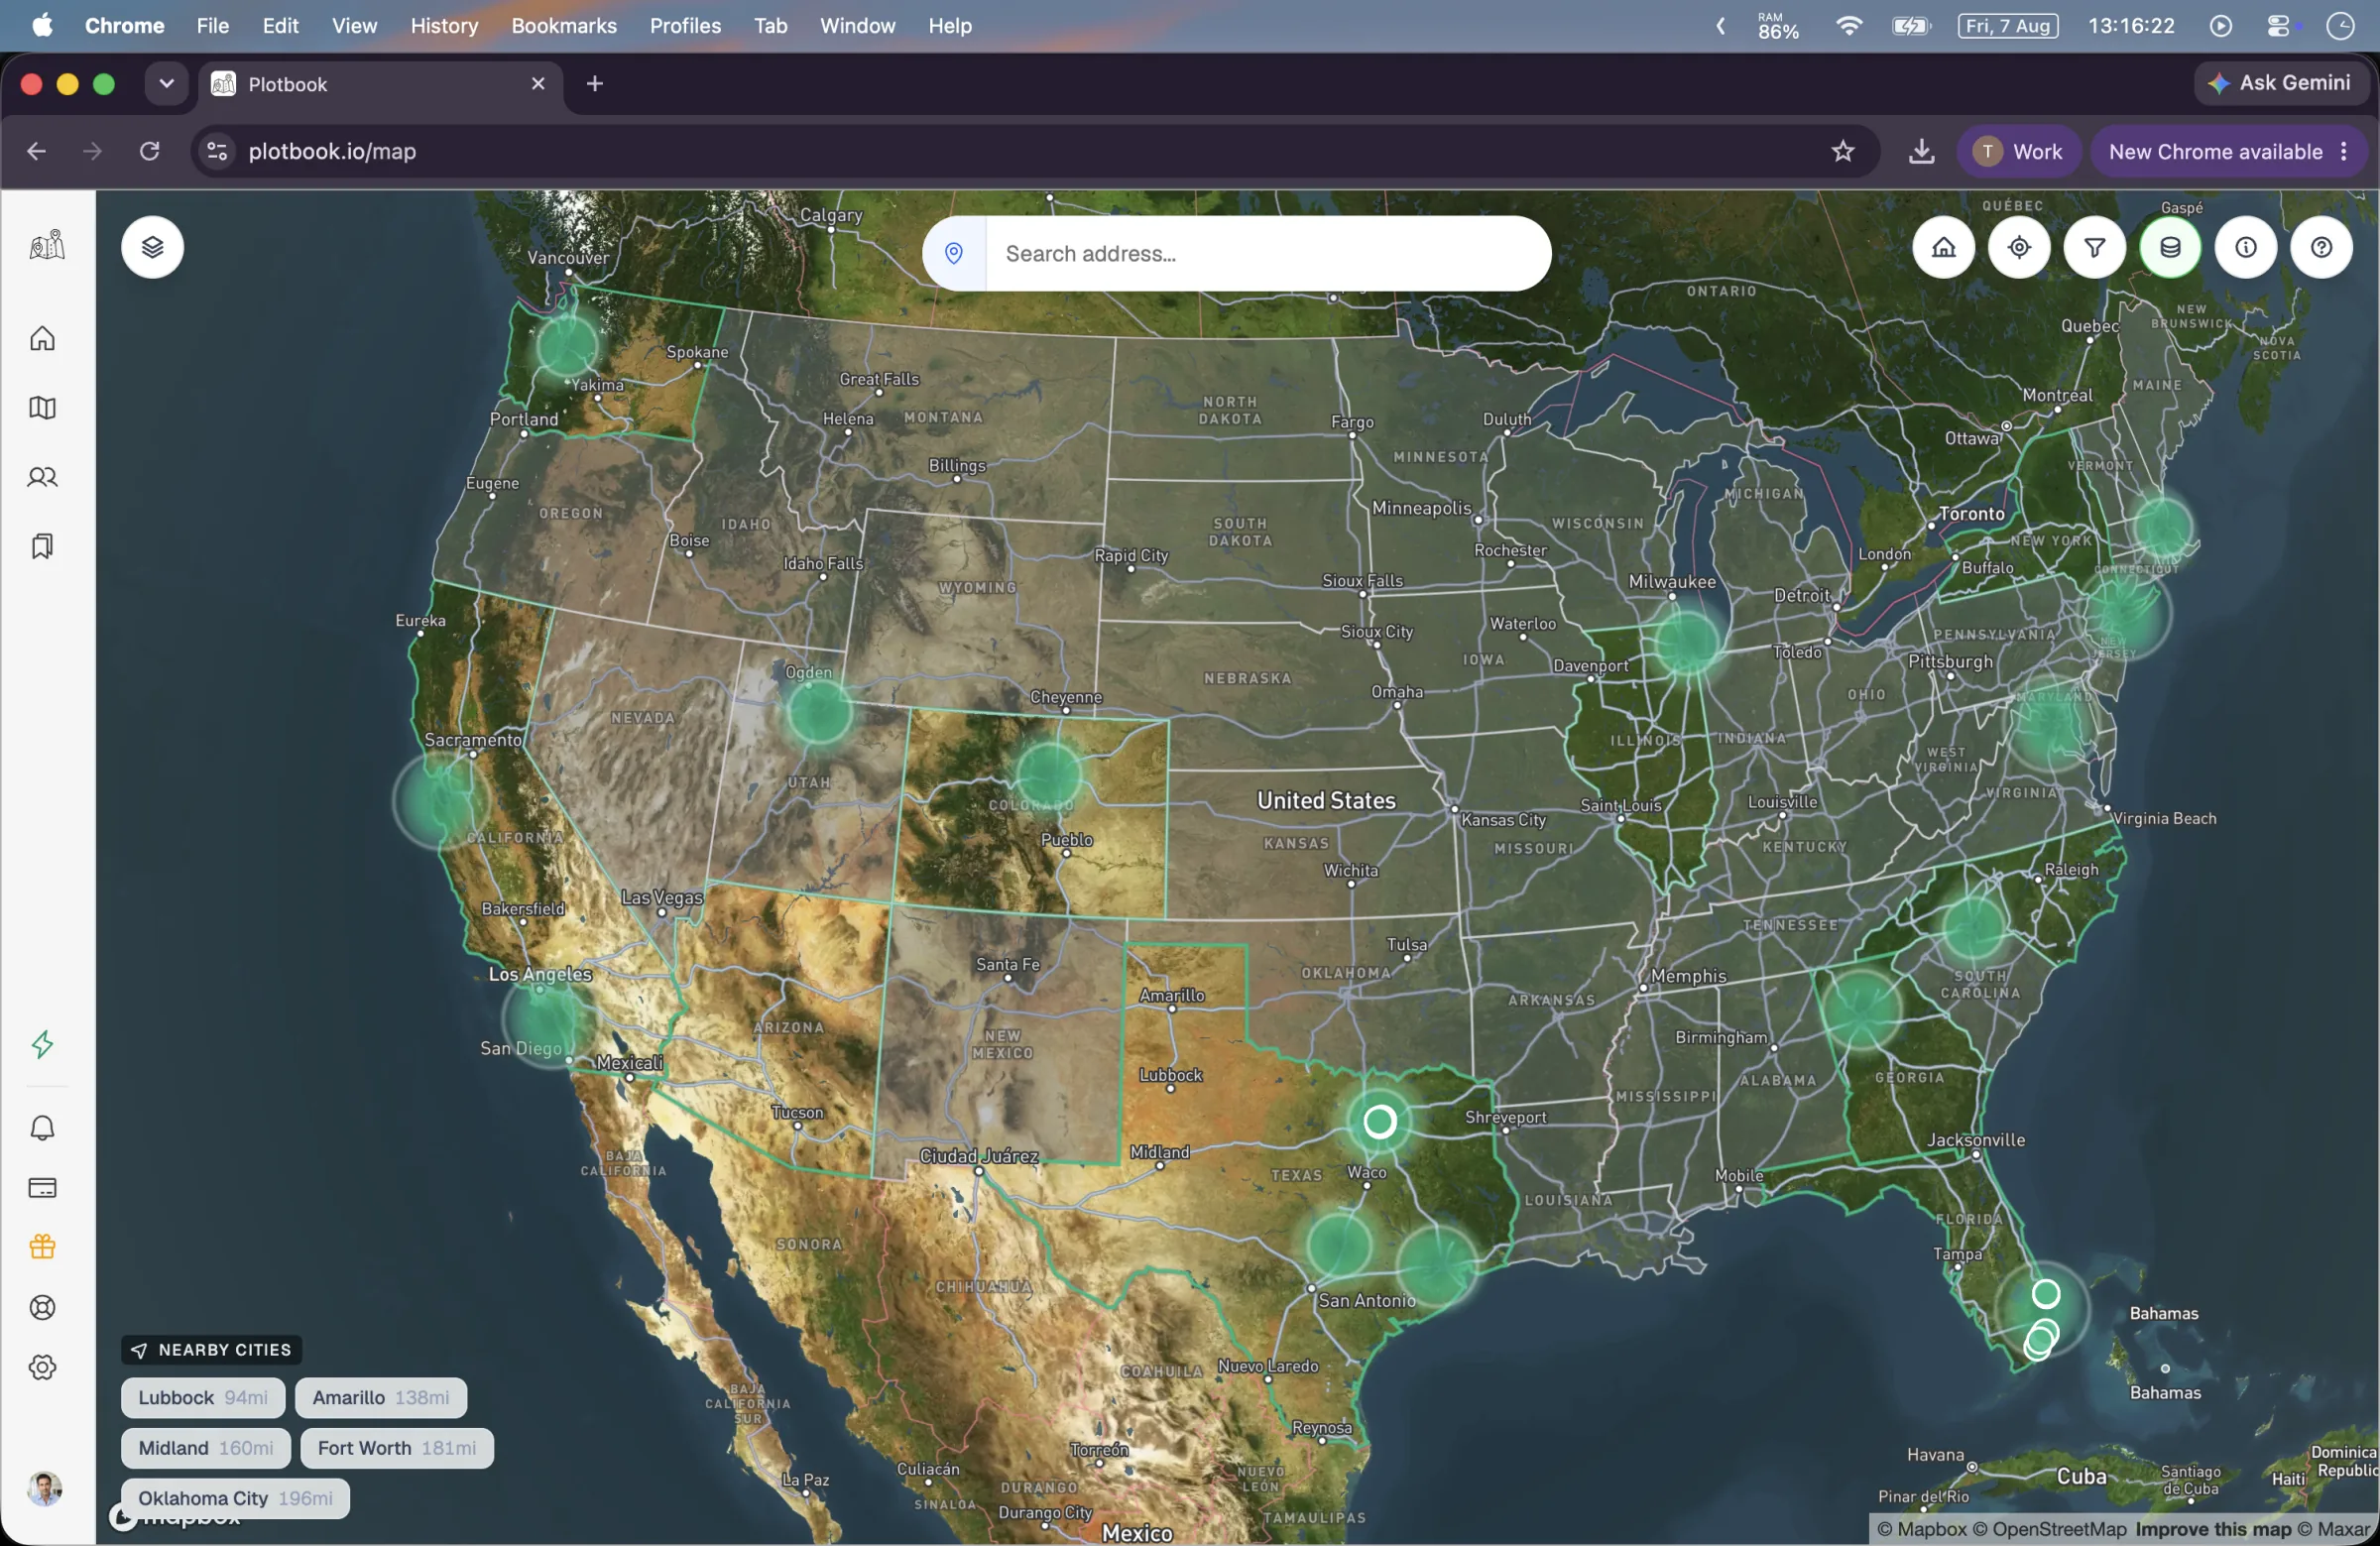
Plotbook starts one step earlier. Nationwide parcel data from Regrid, covering 150M+ parcels, colored across six assessed-value bands, with deed owner names printed on parcels once you zoom past 16. You are looking at households before anyone has put them in a file, sorted by the most visible durable wealth signal in the country. Reading the map costs no credits on any plan, including the trial.
From there the research agent converts a parcel into a person: deterministic classification of the owner entity first, then reverse address lookups, then registry, county record, and contact database work as the entity type demands. What comes out is a named person with contacts, four wealth ranges, and the trail that produced them. That record is the thing Windfall would have needed you to already have.
The other side
What Windfall does better than us
On the data itself, Windfall is operating at a scale and a cadence we are not, and pretending otherwise would be silly.
Population coverage
A household-level dataset refreshed weekly and designed for screening at scale. Plotbook knows nothing about a household until you pay for a research run on one, and then it knows about exactly that one.
Weekly refresh
Their figures are maintained on a weekly cadence. Ours are a snapshot of the moment a run finished, and nothing updates on its own afterwards. For any use where currency matters, that is a decisive difference.
A single sortable figure
Ranking a large file by a precise number is straightforward. Ranking it by four ranges is not. If your workflow is sorting at scale, their presentation is the better one and we would not argue.
Unlimited screening
Their model lets customers screen records without paying per lookup. Plotbook charges 25 credits per research run, which is a poor fit for volume work and a fine fit for considered work.
Delivery into your stack
CRM integrations and data-platform delivery mean the figure lands where your systems already read from. Plotbook has CSV export, on Professional and Enterprise only.
Data science maturity
A well-funded team building wealth models at population scale, with the validation work that implies. Our estimates come from a language model reasoning over what one research run found, which is a narrower and less battle-tested method.
If you have a file and need it valued, Windfall is the better instrument by a clear margin. Plotbook is for the step before that file exists, and for the cases where you want to see the reasoning rather than trust the model.
Running both
Find, then value
The composition is straightforward, because they sit at different points in the pipeline. Plotbook manufactures records from geography. Windfall values records at scale. A team running both would prospect the territory in Plotbook and pipe the resulting households into whatever they already screen with.
The seam is CSV export, which carries the parcel, the four wealth ranges, the confidence score, and the research summary. There is no direct integration with Windfall or with any CRM, and export requires Professional or Enterprise. On the $79 Starter plan you can research and keep profiles but not export them, which is worth knowing before you build a process around it.
One genuine benefit of running both: two independent estimates of the same household, produced by different methods from different inputs. When they agree, that is a stronger signal than either alone. When they disagree, Plotbook's research trail is the one you can open to find out why.
What it costs
Priced per answer
Plotbook bills a subscription plus credits, and credits are spent only when a paid source is called for you. That is a different economic shape from a data subscription, and it suits considered work rather than volume.
- Browsing the map and filtering by value band
- included
- Opening a parcel Plotbook has not seen before
- 1 credits
- Instant owner lookup on a residential address
- 15 credits
- Full research run on an entity-held deed
- 25 credits
- Keeping the result as a profile
- 10 credits
- Exporting to CSV
- 5 credits
Panning, zooming, the six value-band filters, and the deed owner names printed on parcels. Free on every plan, including the trial.
First lookup of a given parcel. Cached afterwards, so returning is free.
Reverse address lookup against residential records, for deeds held in a person's name.
Classification, registry and county records, contact databases, disambiguation. Charged only if it succeeds.
Enrichment and permanent storage in your prospect book, with the four wealth ranges and the research trail.
Professional and Enterprise only. Starter cannot export.
Professional is $199 per month for 2,500 credits, or $159 per month billed annually, covering roughly 60 full research runs plus the map work around them. New subscribers get 7 days and 100 credits. The trial takes a card and converts on day 8, and we email you before it does.
Questions
Plotbook and Windfall, asked directly
Keep comparing
Plotbook vs Catchlight
The other enrichment-first product, aimed specifically at advisor leads.
Plotbook vs WealthEngine
Enterprise screening, and the CoreLogic property data it keeps behind the curtain.
How the estimates are built
The inputs behind the four ranges, and where inference starts and record stops.
Saved Profiles
Where researched prospects live, with the research trail and CSV export.
Produce the record first
If your constraint is information about known households, buy a data layer. If it is that you do not have the households, start on the map and see what a county record turns into.
New subscribers start with 7 days and 100 credits. We email you before the trial ends.